Exam 2: Linear and Quadratic Functions
Exam 1: Functions and Their Graphs297 Questions
Exam 2: Linear and Quadratic Functions302 Questions
Exam 3: Polynomial and Rational Functions354 Questions
Exam 4: Exponential and Logarithmic Functions517 Questions
Exam 5: Trigonometric Functions354 Questions
Exam 6: Analytic Trigonometry342 Questions
Exam 7: Applications of Trigonometric Functions105 Questions
Exam 8: Polar Coordinates; Vectors253 Questions
Exam 9: Analytic Geometry200 Questions
Exam 10: Systems of Equations and Inequalities235 Questions
Exam 11: Sequences; Induction; the Binomial Theorem238 Questions
Exam 12: Counting and Probability115 Questions
Exam 13: A Preview of Calculus: the Limit, Derivative, and Integral of a Function145 Questions
Exam 14: Foundations: a Prelude to Functions234 Questions
Exam 15: Graphing Utilities29 Questions
Select questions type
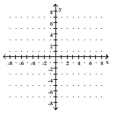
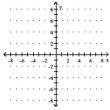
Graph the function. State whether it is increasing, decreasing, or constant..
-
(Multiple Choice)
4.8/5  (32)
(32)
Write the word or phrase that best completes each statement or answers the question.
-The following data represents the amount of money Tom is saving each month since he graduated from college. month 1 2 3 4 5 6 7 savings \ 52 \ 70 \ 81 \ 91 \ 102 \ 118 \ 132 Using the line of best fit for the data set, predict the amount he will save in the 24th month after graduating from
college.
(Short Answer)
4.9/5 (37)
Determine if the type of relation is linear, nonlinear, or none.
-
(Multiple Choice)
4.9/5 (35)
Determine where the function is increasing and where it is decreasing.
-
(Multiple Choice)
4.8/5 (38)
Find the real zeros of the function. List the x-intercepts of the graph of the function.
-
(Multiple Choice)
4.8/5 (38)
Graph the function. State whether it is increasing, decreasing, or constant..
-
(Multiple Choice)
4.8/5 (39)
Write the word or phrase that best completes each statement or answers the question.
-The following scatter diagram shows heights (in inches) of children and their ages.
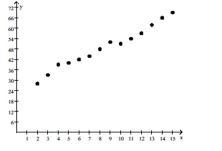 Age (years) What happens to height as age increases?
(Multiple Choice)
4.8/5 (35)
Graph the function using its vertex, axis of symmetry, and intercepts.
-
(Multiple Choice)
4.9/5 (28)
Graph the function. State whether it is increasing, decreasing, or constant..
-
(Multiple Choice)
4.8/5 (36)
Graph the function f by starting with the graph of y = x2 and using transformations (shifting, compressing, stretching,
and/or reflection).
-
(Multiple Choice)
4.8/5 (35)
Solve the problem.
-A flare fired from the bottom of a gorge is visible only when the flare is above the rim. If it is fired with an initial velocity of , and the gorge is deep, during what interval can the flare be seen?
(Multiple Choice)
4.8/5 (31)
Use a graphing utility to find the equation of the line of best fit. Round to two decimal places, if necessary.
- x 1 3 5 7 9 y 143 116 100 98 90
(Multiple Choice)
4.8/5 (29)
Use a graphing utility to find the equation of the line of best fit. Round to two decimal places, if necessary.
- x 0 3 4 5 12 y 8 2 6 9 12
(Multiple Choice)
4.9/5 (34)
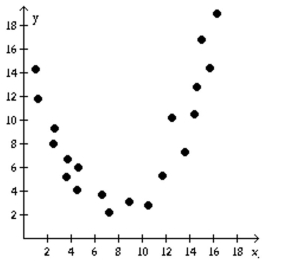
Plot and interpret the appropriate scatter diagram.
-The table gives the times spent watching TV and the grades of several students. Weekly TV () 6 12 18 24 30 36 Grade (\%) 92.5 87.5 72.5 77.5 62.5 57.5 Which scatter diagram describes the data and the relationship, if any?
(Multiple Choice)
5.0/5 (36)
employees each year.
Choose the one alternative that best completes the statement or answers the question.
Use factoring to find the zeros of the quadratic function. List the x-intercepts of the graph of the function.
-
(Multiple Choice)
5.0/5 (35)
Filters
- Essay(0)
- Multiple Choice(0)
- Short Answer(0)
- True False(0)
- Matching(0)