Exam 2: Linear and Quadratic Functions
Exam 1: Functions and Their Graphs297 Questions
Exam 2: Linear and Quadratic Functions302 Questions
Exam 3: Polynomial and Rational Functions354 Questions
Exam 4: Exponential and Logarithmic Functions517 Questions
Exam 5: Trigonometric Functions354 Questions
Exam 6: Analytic Trigonometry342 Questions
Exam 7: Applications of Trigonometric Functions105 Questions
Exam 8: Polar Coordinates; Vectors253 Questions
Exam 9: Analytic Geometry200 Questions
Exam 10: Systems of Equations and Inequalities235 Questions
Exam 11: Sequences; Induction; the Binomial Theorem238 Questions
Exam 12: Counting and Probability115 Questions
Exam 13: A Preview of Calculus: the Limit, Derivative, and Integral of a Function145 Questions
Exam 14: Foundations: a Prelude to Functions234 Questions
Exam 15: Graphing Utilities29 Questions
Select questions type
Determine, without graphing, whether the given quadratic function has a maximum value or a minimum value and then
find that value.
-
(Multiple Choice)
4.8/5  (41)
(41)
Determine, without graphing, whether the given quadratic function has a maximum value or a minimum value and then
find that value.
-
(Multiple Choice)
4.8/5 (31)
Determine where the function is increasing and where it is decreasing.
-
(Multiple Choice)
5.0/5 (34)
Write the word or phrase that best completes each statement or answers the question.
Solve the problem.
-The one-day temperatures for 12 world cities along with their latitudes are shown in the table below. Make a
scatter diagram for the data. Then find the line of best fit and graph it on the scatter diagram. City Temperature (F) Latitude Oslo, Norway 3 5 Seattle, WA 5 4 Anchorage, AK 4 6 Paris, France 6 4 Vancouver, Canada 5 4 London, England 4 5 Tokyo, Japan 5 3 Cairo, Egypt 8 3 Mexico City, Mexico 8 1 Miami, FL 8 2 New Delhi, India 9 2 Manila, Philippines 9 1 Latitude (degrees) 
(Essay)
4.8/5 (27)
Line of best fit = -0.68x + 82.91
Choose the one alternative that best completes the statement or answers the question.
-A marina owner wishes to estimate a linear function that relates boat length in feet and its draft (depth of boat below water line) in feet. He collects the following data. Let boat length represent the independent variable and
Draft represent the dependent variable. Use a graphing utility to draw a scatter diagram and to find the line of
Best fit. What is the draft for a boat 60 ft in length (to the nearest tenth)? Boat Length (ft) Draft (ft) 25 2.5 25 2 30 3 30 3.5 45 6 45 7 50 7 50 8
(Multiple Choice)
4.8/5 (32)
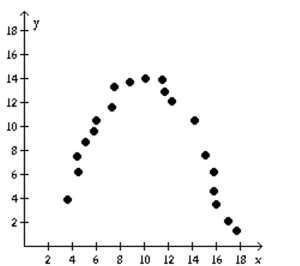
Use a graphing calculator to plot the data and find the quadratic function of best fit.
-The number of housing starts in one beachside community remained fairly level until 1992 and then began to increase. The following data shows the number of housing starts since 1992 (x = 1). Use a graphing calculator to
Plot a scatter diagram. What is the quadratic function of best fit? Year, x Housing Starts, H 1 200 2 210 3 230 4 240 5 250 6 230 7 215 8 208
(Multiple Choice)
4.8/5 (27)
Solve the problem.
-The profit that the vendor makes per day by selling pretzels is given by the function . Find the number of pretzels that must be sold to maximize profit.
(Multiple Choice)
4.9/5 (46)
Determine if the type of relation is linear, nonlinear, or none.
-
(Multiple Choice)
4.8/5 (43)
Determine, without graphing, whether the given quadratic function has a maximum value or a minimum value and then
find that value.
-
(Multiple Choice)
4.8/5 (42)
employees each year.
Choose the one alternative that best completes the statement or answers the question.
Use factoring to find the zeros of the quadratic function. List the x-intercepts of the graph of the function.
-
(Multiple Choice)
4.7/5 (33)
Determine where the function is increasing and where it is decreasing.
-
(Multiple Choice)
4.9/5 (35)
Find the zeros of the quadratic function by completing the square. List the x-intercepts of the graph of the function.
-
(Multiple Choice)
4.7/5 (35)
Find the zeros of the quadratic function by completing the square. List the x-intercepts of the graph of the function.
-
(Multiple Choice)
4.9/5 (37)
Use the slope and y-intercept to graph the linear function.
-
(Multiple Choice)
4.9/5 (40)
employees each year.
Choose the one alternative that best completes the statement or answers the question.
Use factoring to find the zeros of the quadratic function. List the x-intercepts of the graph of the function.
-
(Multiple Choice)
4.8/5 (32)
Solve the inequality. Express your answer using interval notation. Graph the solution set.
-
(Multiple Choice)
4.9/5 (31)
Solve the problem.
-A projectile is fired from a cliff 300 feet above the water at an inclination of 45° to the horizontal, with a muzzle velocity of 300 feet per second. The height h of the projectile above the water is given by where x is the horizontal distance of the projectile from the base of the cliff. How far from the base of the cliff is
The height of the projectile a maximum?
(Multiple Choice)
4.9/5 (35)
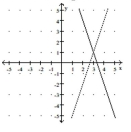
Solve the problem.
-Let be the function represented by the dashed line and be the function represented by the solid lin Solve the equation .
(Multiple Choice)
4.8/5 (32)
Filters
- Essay(0)
- Multiple Choice(0)
- Short Answer(0)
- True False(0)
- Matching(0)