Exam 29: Models for Decision Making
Exam 2: Data20 Questions
Exam 3: Surveys and Sampling26 Questions
Exam 4: Displaying and Describing Categorical Data21 Questions
Exam 5: Displaying and Describing Quantitative Data24 Questions
Exam 6: Correlation and Linear Regression36 Questions
Exam 7: Randomness and Probability28 Questions
Exam 8: Random Variables and Probability Models24 Questions
Exam 9: The Normal Distribution21 Questions
Exam 10: Confidence Intervals for Means20 Questions
Exam 11: Confidence Intervals for Proportions28 Questions
Exam 12: Confidence Intervals for Means21 Questions
Exam 13: Testing Hypotheses18 Questions
Exam 14: Comparing Two Groups19 Questions
Exam 15: Inference for Counts: Chi-Square20 Questions
Exam 16: Inference for Regression22 Questions
Exam 17: Understanding Residuals22 Questions
Exam 18: Multiple Regression15 Questions
Exam 19: Data13 Questions
Exam 22: Business Statistics20 Questions
Exam 24: Decision Making and Risk25 Questions
Exam 25: Introduction to Data Mining11 Questions
Exam 26: Exploring and Collecting Data43 Questions
Exam 27: Modeling With Probability20 Questions
Exam 28: Inference for Decision Making25 Questions
Exam 29: Models for Decision Making38 Questions
Exam 30: Selected Topics in Decision Making22 Questions
Select questions type
A large pharmaceutical company selected a random sample of new hires and
Obtained their job performance ratings based on their first six months with the company.
These data were used to build a multiple regression model to predict the job performance
Of new hires based on age, GPA and gender (female = 1 and male = 0). The results of
The analysis are shown below. How much of the variability in Job Performance is
Explained by the regression model? The regression equation is
Job Performance Age GPA Gender
Predictor Coef SE Coef T P Constant -60.76 22.49 -2.70 0.012 Age 4.802 1.177 4.08 0.000 GPA 1.443 2.379 0.61 0.549 Gender 9.060 2.314 3.92 0.001
(Multiple Choice)
4.8/5  (52)
(52)
The time series graph below shows annual sales figures (in thousands of dollars)
For a well known department store chain. The dominant component in these data is 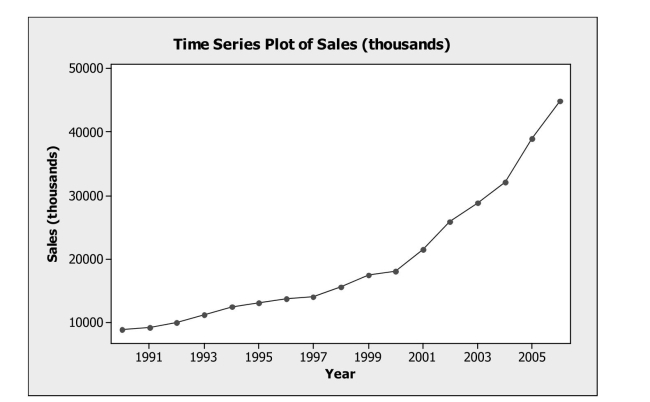
(Multiple Choice)
4.7/5 (32)
Data were collected for a sample of 12 pharmacists to determine if years of
Experience and salary are related. Below are the regression analysis results. The
Dependent variable is Salary in thousands of dollars. How much of the variability in
Pharmacists' salary is accounted for by years of experience? Regression Analysis: Salary versus Years Experience
The regression equation is
Salary Years Experience
Predictor Coef SE Coef T P Constant 37.164 3.381 Years Experience 1.4882 0.2149
(Multiple Choice)
4.7/5 (38)
A linear regression model was fit to data collected over a 13 year period
Representing technology adoption over time. Based on the regression output below, the
Durbin Watson statistic indicates
Regression Analysis: Technology Adoption versus Time The regression equation is
Technology Adoption Time
Predictor Coef SE Coef T P Constant -11.935 3.711 -3.22 0.008 Time 3.3709 0.4676 7.21 0.000
Durbin-Watson statistic
(Multiple Choice)
4.8/5 (29)
A large pharmaceutical company selected a random sample of new hires and
Obtained their job performance ratings based on their first six months with the company.
These data were used to build a multiple regression model to predict the job performance
Of new hires based on age, GPA and gender (female = 1 and male = 0). The regression
Equation is:
Which of the following is the correct interpretation for the regression coefficient of
Gender?
(Multiple Choice)
4.9/5 (37)
A first-order autoregressive model, AR (1) was fit to monthly closing stock
Prices, adjusted for dividends, of Boeing Corporation from January 2006 through August
2008 (closing price on the first trading day of the month). Based on the results shown
Below, the forecast a month in which the previous month's closing price was $67.52 is Final Estimates of Parameters Type Coef SE Coef T P AR 1 0.9098 0.0969 9.39 0.000 Constant 6.835 1.207 5.67 0.000
(Multiple Choice)
4.8/5 (35)
Which of the following measures is used to check for collinearity when building a
Multiple regression model?
(Multiple Choice)
4.8/5 (35)
Stock prices and earnings per share (EPS) data were collected for a sample of 15
Companies. Below are the regression results. Which of the following statement is true
About the correlation between stock price and EPS? The regression equation is
Stock Price EPS
Predictor Coef SE Coef T P Constant -0.486 4.032 -0.12 0.906 EPS 14.8129 0.9437 15.70 0.000
(Multiple Choice)
4.9/5 (47)
The regression model developed to predict a firm's Price-Earnings Ratio (PE)
Based on Growth Rate, Profit Margin, and whether or not the firm is Green (1 = Yes, 0 =
no. is
Which of the following is the correct interpretation for the regression coefficient of
Green?
(Multiple Choice)
4.8/5 (40)
If the point in the upper left corner of the scatterplot shown below is removed,
What will happen to the correlation (r) and the slope of the line of best fit (b)? 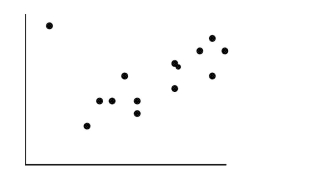
(Multiple Choice)
4.8/5 (43)
The following is output from regression analysis performed to develop a model
For predicting a firm's Price-Earnings Ratio (PE) based on Growth Rate, Profit Margin,
And whether or not the firm is Green (1 = Yes, 0 = No). At = .05 we can conclude that
? The regression equation is
Growth Rate Profit Margin Green?
Predictor Coef SE Coef T P Constant 8.043 1.570 5.12 0.000 Growth Rate 0.7569 0.1355 5.59 0.000 Profit Margin 0.05162 0.03239 1.59 0.139 Green? 2.0900 0.7945 2.63 0.023
(Multiple Choice)
4.8/5 (34)
A large pharmaceutical company selected a random sample of new hires and
Obtained their job performance ratings based on their first six months with the company.
These data were used to build a multiple regression model to predict the job performance
Of new hires based on age, GPA and gender (female = 1 and male = 0). The results of
The analysis are shown below. At = .05 we can conclude that
? The regression equation is
Job Performance Age Gender
Predictor Coef SE Coef T P Constant -60.76 22.49 -2.70 0.012 Age 4.802 1.177 4.08 0.000 GPA 1.443 2.379 0.61 0.549 Gender 9.060 2.314 3.92 0.001
(Multiple Choice)
4.8/5 (48)
Quarterly returns were forecasted for a mutual fund comprised of technology
Stocks. The forecast errors for the last six quarters are as follows: -.47, 1.12, -.85, 1.27,
)07, and -.05. The MAD based on these forecast errors is
(Multiple Choice)
4.9/5 (43)
In order to examine if the size of cash bonuses depends on pay scale, data were
Obtained on the average annual cash bonus and the average annual pay for a sample of 20
Companies. A regression model was fit to these data. From its plot of residuals versus
Fitted values shown below, which assumption appears to be violated? 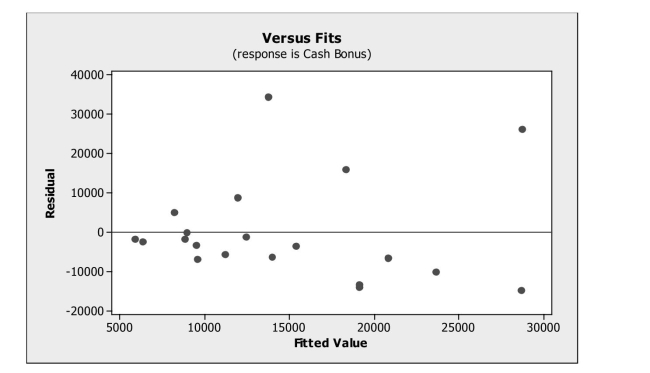
(Multiple Choice)
4.7/5 (45)
For many countries tourism is an important source of revenue. Data are collected
On the number of foreign visitors to a country (in millions) and total tourism revenue (in
Billions of dollars) for a sample of 10 countries. Below is partial regression analysis
Output with tourism revenue as the dependent variable. The calculated t-statistic to test
Whether the regression slope is significant is
Regression Analysis: Tourism ($ bill) versus Visitors (mill) The regression equation is
Tourism bill Visitors (mill)
Predictor Coef sE Coef T P Constant 21.464 3.462 Visitors (mil1) 0.29497 0.07917
(Multiple Choice)
4.8/5 (31)
In order to examine if there is a relationship between the size of cash bonuses and
Pay scale, data were obtained on the average annual cash bonus and the average annual
Pay for a sample of 20 companies. Below is the regression analysis output with annual
Cash bonus as the dependent variable. What is the correlation between average annual
Cash bonus and average annual pay?
Regression Analysis: Cash Bonus versus Pay The regression equation is
Cash Bonus Pay
Predictor Coef SE Coef T P Constant -4877 9106 -0.54 0.599 Pay 0.2453 0.1079 2.27 0.036
(Multiple Choice)
4.8/5 (46)
Weekly commodity prices for heating oil (in cents) were obtained and regressed
Against time. The residual plots from fitting the linear model are shown below. Which
Assumptions appear to be violated? 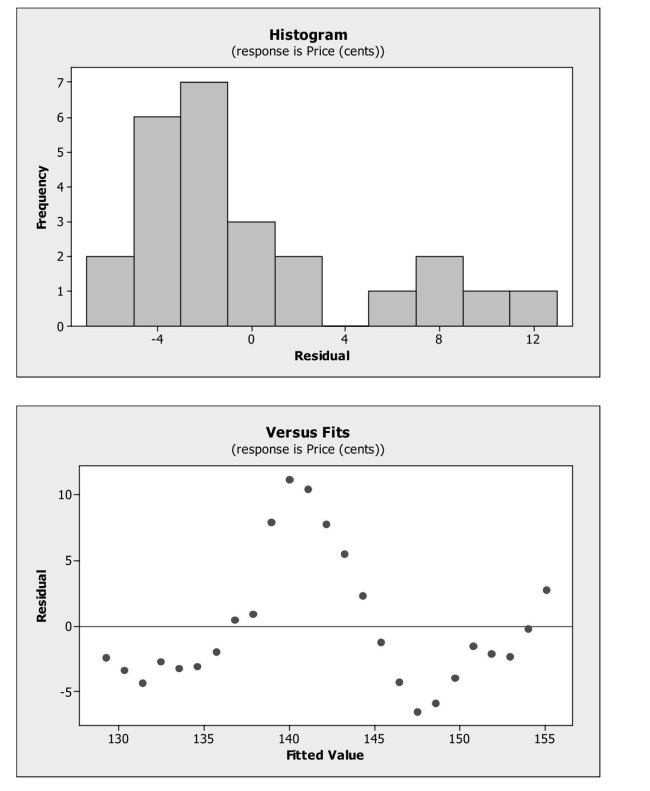
(Multiple Choice)
5.0/5 (35)
Which statement about influential points is true?
I. Removal of an influential point changes the regression line.
II. A high leverage point is always influential.
III. Influential points have large residuals.
(Multiple Choice)
4.9/5 (40)
Filters
- Essay(0)
- Multiple Choice(0)
- Short Answer(0)
- True False(0)
- Matching(0)