Exam 26: Exploring and Collecting Data
Exam 2: Data20 Questions
Exam 3: Surveys and Sampling26 Questions
Exam 4: Displaying and Describing Categorical Data21 Questions
Exam 5: Displaying and Describing Quantitative Data24 Questions
Exam 6: Correlation and Linear Regression36 Questions
Exam 7: Randomness and Probability28 Questions
Exam 8: Random Variables and Probability Models24 Questions
Exam 9: The Normal Distribution21 Questions
Exam 10: Confidence Intervals for Means20 Questions
Exam 11: Confidence Intervals for Proportions28 Questions
Exam 12: Confidence Intervals for Means21 Questions
Exam 13: Testing Hypotheses18 Questions
Exam 14: Comparing Two Groups19 Questions
Exam 15: Inference for Counts: Chi-Square20 Questions
Exam 16: Inference for Regression22 Questions
Exam 17: Understanding Residuals22 Questions
Exam 18: Multiple Regression15 Questions
Exam 19: Data13 Questions
Exam 22: Business Statistics20 Questions
Exam 24: Decision Making and Risk25 Questions
Exam 25: Introduction to Data Mining11 Questions
Exam 26: Exploring and Collecting Data43 Questions
Exam 27: Modeling With Probability20 Questions
Exam 28: Inference for Decision Making25 Questions
Exam 29: Models for Decision Making38 Questions
Exam 30: Selected Topics in Decision Making22 Questions
Select questions type
For families who live in apartments the correlation between the family's income
And the amount of rent they pay is r = 0.60. Which is true?
I. In general, families with higher incomes pay more in rent.
II. On average, families spend 60% of their income on rent.
III. The regression line passes through 60% of the (income$, rent$) data
Points.
(Multiple Choice)
4.9/5  (37)
(37)
Below is a stem and leaf display of prices for a sample homes recently sold in a
Metropolitan area in the southeastern region of the U.S.
Stem-and-Leaf Display: Home Prices Stem-and-leaf of Home Prices
Leaf Unit
4 1 5788 (4) 2 0123 5 2 89 3 3 0 2 3 5 1 4 0
Which of the following statements is true?
(Multiple Choice)
4.8/5 (33)
A recent survey of online shoppers asked them to indicate the primary reason they
Shop via the Internet. The table summarizes responses by reason and gender. What
Percent of males cite Convenience as the primary reason they shop online? Reason for Shopping Online Male Female Convenience 249 90 Better Prices 110 99 Greater Selection 41 211
(Multiple Choice)
5.0/5 (36)
A regression analysis of company profits and the amount of money the company spent on advertising produced a . Which of these is true?
I. This model can correctly predict the profit for of companies.
II. of the variance in company profit can be accounted for by the model.
III. On average, companies spend about of their profits on advertising.
(Multiple Choice)
4.8/5 (30)
In their October 2003 issue, Consumer Reports evaluated the price and
Performance of 23 models of cordless phones. Computer output gives the summary
Statistics for the prices ($) shown in the table. Based on these results, which of the
Following is true? Min Q1 Median Q3 Max Mean SD 15 30 50 110 200 71.75 52.08
(Multiple Choice)
4.8/5 (40)
A researcher is conducting a study on eating disorders. Using a list of recent
Participants in the online Weight Watchers program, she randomly selects a sample from
The alphabetized list. This list represents the
(Multiple Choice)
4.9/5 (47)
A researcher is conducting a study to determine how knowledgeable teenagers are
About making good food choices. She decides to interview teenagers eating at a fast food
Restaurant. The results may be biased because this is a
(Multiple Choice)
4.9/5 (30)
What scale of measurement is type of workplace injuries (slip and fall, stress
Related, etc.)?
(Multiple Choice)
4.8/5 (32)
A manufacturer of batteries routinely tests its products to determine lifetime
(hours of continuous usage). Suppose they select a sample of 30 AAA batteries and find
That the average lifetime is 1500 hours. This is a
(Multiple Choice)
4.8/5 (25)
A correlation of zero between two quantitative variables means that
(Multiple Choice)
4.9/5 (34)
A recent survey of online shoppers asked them to indicate the primary reason they
Shop via the Internet. The table summarizes responses by reason and gender. What
Percent of respondents who cited Greater Selection as the primary reason they shop
Online were females? Reason for Shopping Online Male Female Convenience 249 90 Better Prices 110 99 Greater Selection 41 211
(Multiple Choice)
4.9/5 (32)
Which is true for the data shown in the histogram? 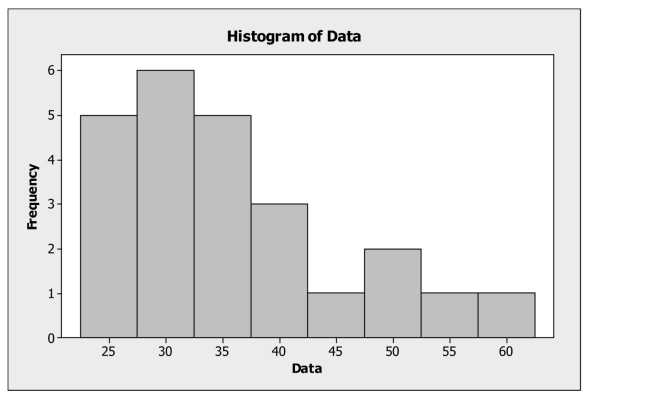 I. The distribution is skewed to the right.
II) The mean is probably smaller than the median.
III) It is appropriate to summarize these data with the mean and standard deviation.
I. The distribution is skewed to the right.
II) The mean is probably smaller than the median.
III) It is appropriate to summarize these data with the mean and standard deviation.
(Multiple Choice)
4.9/5 (29)
The U.S. Bureau of Labor Statistics publishes the monthly CPI (consumer price
Index). This index shows the change in prices paid by urban consumers for a market
Basket of goods and services. These data are
(Multiple Choice)
4.7/5 (34)
In listing a property, real estate agencies provides information on a number of
Variables. Which of the following variables related to property listings is categorical?
(Multiple Choice)
4.9/5 (35)
A government agency has 6000 employees. As an alternative to the traditional
Five day work week, employees were asked whether they preferred a four day work week
(10 hours per day) or flexible hours. The segmented bar chart below is based on the data
Collected. Which of the following statements is true about work week preferences and
Age category? 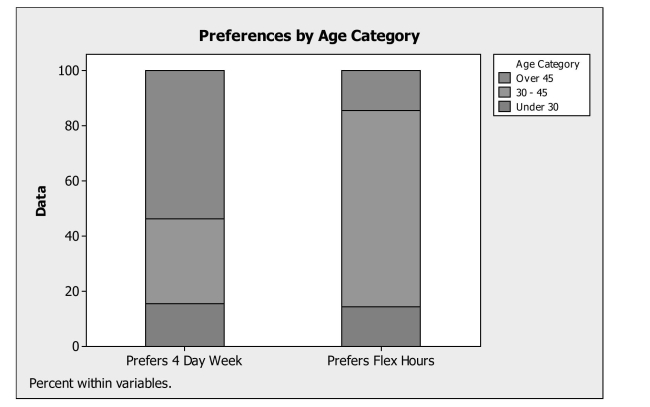
(Multiple Choice)
4.8/5 (30)
If a parameter is computed from a set of data, which of the following statements is
True?
(Multiple Choice)
4.8/5 (31)
Which is true of the data shown in the histogram? 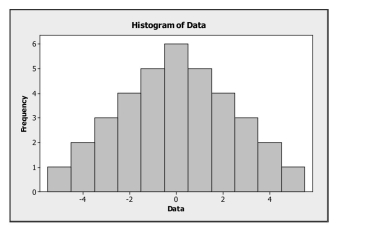 I. The distribution is approximately symmetric.
II) The mean and median are approximately equal.
III) The median and IQR summarize the data better than the mean and standard
Deviation.
I. The distribution is approximately symmetric.
II) The mean and median are approximately equal.
III) The median and IQR summarize the data better than the mean and standard
Deviation.
(Multiple Choice)
4.8/5 (31)
An office supply chain has stores in two locations, Dayton and Scranton. One of
These stores is to be closed within the coming year, and to help make the decision,
Management reviews sales data. Below are boxplots for monthly unit sales for both
Locations. 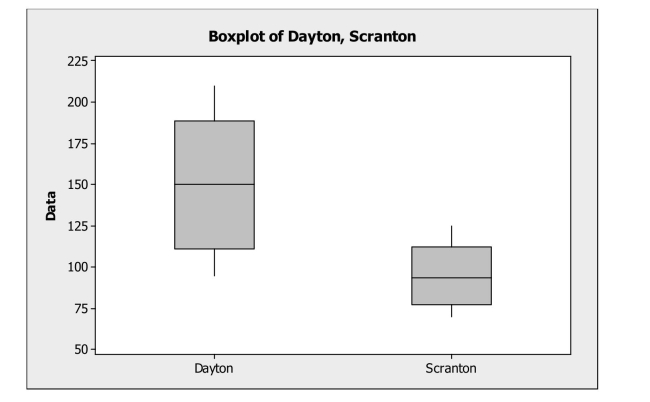 Which of the following statement is not correct?
(Multiple Choice)
4.8/5 (38)
A customer service center keeps track of the number of complaints received each
Day about one of their new products. The numbers of complaints received over the last
11 day period are 19, 18, 22, 21, 17, 18, 22, 19, 16, 23, and 25. The median for this
Sample of data is
(Multiple Choice)
4.7/5 (27)
Suppose a sample of 60 business majors revealed that the average time spent
Studying per week is 22 hours with a standard deviation of 4 hours. For one student
Reporting that he studies 16 hours per week, the corresponding z score is
(Multiple Choice)
4.9/5 (35)
Filters
- Essay(0)
- Multiple Choice(0)
- Short Answer(0)
- True False(0)
- Matching(0)