Exam 5: Displaying and Describing Quantitative Data
Exam 2: Data20 Questions
Exam 3: Surveys and Sampling26 Questions
Exam 4: Displaying and Describing Categorical Data21 Questions
Exam 5: Displaying and Describing Quantitative Data24 Questions
Exam 6: Correlation and Linear Regression36 Questions
Exam 7: Randomness and Probability28 Questions
Exam 8: Random Variables and Probability Models24 Questions
Exam 9: The Normal Distribution21 Questions
Exam 10: Confidence Intervals for Means20 Questions
Exam 11: Confidence Intervals for Proportions28 Questions
Exam 12: Confidence Intervals for Means21 Questions
Exam 13: Testing Hypotheses18 Questions
Exam 14: Comparing Two Groups19 Questions
Exam 15: Inference for Counts: Chi-Square20 Questions
Exam 16: Inference for Regression22 Questions
Exam 17: Understanding Residuals22 Questions
Exam 18: Multiple Regression15 Questions
Exam 19: Data13 Questions
Exam 22: Business Statistics20 Questions
Exam 24: Decision Making and Risk25 Questions
Exam 25: Introduction to Data Mining11 Questions
Exam 26: Exploring and Collecting Data43 Questions
Exam 27: Modeling With Probability20 Questions
Exam 28: Inference for Decision Making25 Questions
Exam 29: Models for Decision Making38 Questions
Exam 30: Selected Topics in Decision Making22 Questions
Select questions type
Analyze data of quantitative variables.
-The following table shows closing share prices for a small sample of companies. The
Mean closing share price is COMPANY CLOSING SHARE PRICE - 08/07 3M Dental Products 86.95 Tyco Electronics Power Systems 47.45 Kyocera America Inc. 94.10 Pfizer Inc. 22.39 Xerox Company 17.56 Northrop Grumman Corporation 75.81 Lockheed Martin Maritime Systems 100.17 Sony DADC 51.91 Matsushita Electronic Components 17.91 Foster Wheeler Environmental Corp. 55.67
(Multiple Choice)
4.7/5  (30)
(30)
Compare results using standardization.
-The following table shows closing share prices for a small sample of companies. The
Z score for the share price for Matsushita Electronic Components is COMPANY CLOSING SHARE PRICE - 08/07 3M Dental Products 86.95 Tyco Electronics Power Systems 47.45 Kyocera America Inc. 94.10 Pfizer Inc. 22.39 Xerox Company 17.56 Northrop Grumman Corporation 75.81 Lockheed Martin Maritime Systems 100.17 Sony DADC 51.91 Matsushita Electronic Components 17.91 Foster Wheeler Environmental Corp. 55.67
(Multiple Choice)
4.9/5 (36)
Describe displays of distributions.
-Below is a histogram of salaries (in $) for a sample of U.S. marketing managers. The
Most appropriate measure of central tendency for these data is the 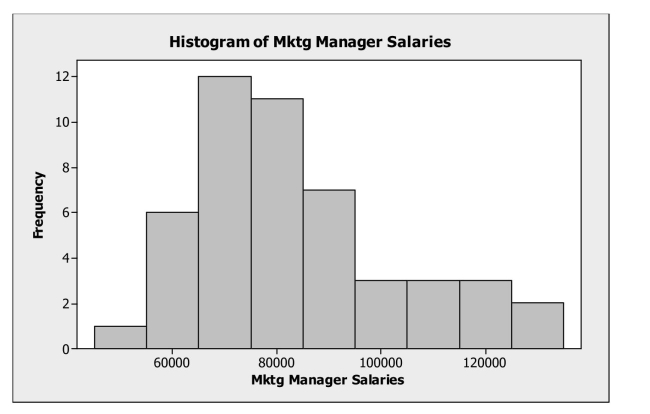
(Multiple Choice)
4.7/5 (44)
Data were collected on the hourly wage ($) for two types of marketing managers: (1)
advertising / promotion managers and (2) sales managers. The results were used to create
the following histograms. 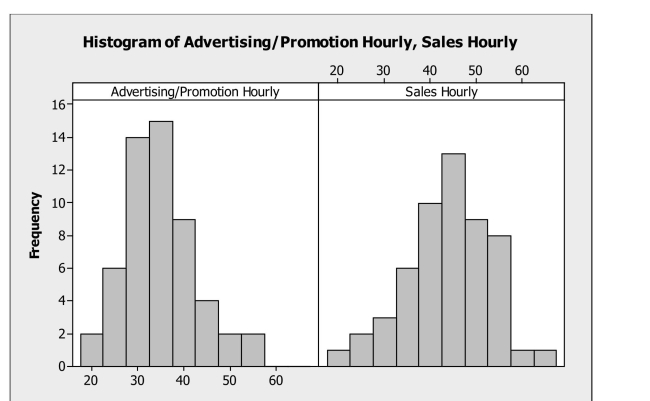 a. Describe the hourly wage distribution for advertising / promotion managers.
b. Describe the hourly wage distribution for sales managers.
c. Compare the hourly wages for the two types of marketing managers based on the
histograms.
a. Describe the hourly wage distribution for advertising / promotion managers.
b. Describe the hourly wage distribution for sales managers.
c. Compare the hourly wages for the two types of marketing managers based on the
histograms.
(Essay)
4.8/5 (21)
Filters
- Essay(0)
- Multiple Choice(0)
- Short Answer(0)
- True False(0)
- Matching(0)