Exam 11: Simple Linear Regression
Exam 1: Statistics, Data, and Statistical Thinking73 Questions
Exam 2: Methods for Describing Sets of Data194 Questions
Exam 3: Probability283 Questions
Exam 4: Discrete Random Variables133 Questions
Exam 5: Continuous Random Variables139 Questions
Exam 6: Sampling Distributions47 Questions
Exam 7: Inferences Based on a Single Sample: Estimation With Confidence Intervals124 Questions
Exam 8: Inferences Based on a Single Sample: Tests of Hypothesis140 Questions
Exam 9: Inferences Based on a Two Samples: Confidence Intervals and Tests of Hypotheses94 Questions
Exam 10: Analysis of Variance: Comparing More Than Two Means90 Questions
Exam 11: Simple Linear Regression111 Questions
Exam 12: Multiple Regression and Model Building131 Questions
Exam 13: Categorical Data Analysis60 Questions
Exam 14: Nonparametric Statistics90 Questions
Select questions type
A realtor collected the following data for a random sample of ten homes that recently sold in her area. House Asking Price Days on Market A \ 114,500 29 B \ 149,900 16 C \ 154,700 59 D \ 159,900 42 E \ 160,000 72 F \ 165,900 45 G \ 169,700 12 H \ 171,900 39 I \ 175,000 81 J \ 289,900 121 a. Find a 90% confidence interval for the mean number of days on the market for all houses listed at $150,000. b. Suppose a house has just been listed at $150,000. Find a 90% prediction interval for the number of days the house will be on the market before it sells.
(Essay)
4.7/5  (27)
(27)
To investigate the relationship between yield of potatoes, y, and level of fertilizer application, x, a researcher divides a field into eight plots of equal size and applies differing amounts of fertilizer to each. The yield of potatoes (in pounds) and the fertilizer application (in pounds) are recorded for each plot. The data are as follows: x 1 1.5 2 2.5 3 3.5 4 4.5 y 25 31 27 28 36 35 32 34
Summary statistics yield , and . Calculate the coefficient of determination.
(Essay)
4.8/5 (34)
What is the relationship between diamond price and carat size? 307 diamonds were sampled and a straight-line relationship was hypothesized between y = diamond price (in dollars) and x = size of the diamond (in carats). The simple linear regression for the analysis is shown below: Least Squares Linear Regression of PRICE 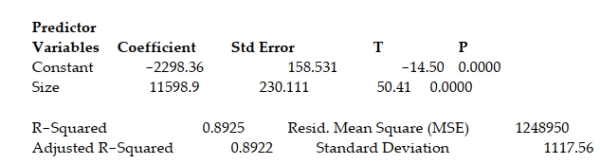 Interpret the standard deviation of the regression model.
(Multiple Choice)
4.8/5 (27)
Consider the following pairs of observations: x 2 3 5 5 6 y 1.3 1.6 2.1 2.2 2.7 a. Construct a scattergram for the data. Does the scattergram suggest that y is positively linearly related to x? b. Find the slope of the least squares line for the data and test whether the data provide sufficient evidence that y is positively linearly related to x. Use α = .05.
(Essay)
4.7/5 (27)
Consider the following pairs of measurements: x 5 8 3 4 9 y 6.2 3.4 7.5 8.1 3.2
a. Construct a scattergram for the data.
b. Use the method of least squares to model the relationship between and .
c. Calculate SSE, , and .
d. What percentage of the observed -values fall within of the values of predicted by the least squares model? 11.4 Assessing the Utility of the Model: Making Inferences about the Slope β1 1 Construct Confidence Interval for β1
(Essay)
4.9/5 (31)
Suppose you fit a least squares line to 22 data points and the calculated value of SSE is .678. a. Find s2, the estimator of σ2. b. Find s, the estimator of σ. c. What is the largest deviation you might expect between any one of the 22 points and the least squares line?
(Essay)
4.8/5 (34)
A breeder of Thoroughbred horses wishes to model the relationship between the gestation period and the length of life of a horse. The breeder believes that the two variables may follow a linear trend. The information in the table was supplied to the breeder from various thoroughbred stables across the state. Horse Gestation period Life Length Horse Gestation period Life Length x (days) y (years) x (days) y (years) 1 416 24 5 356 22 2 279 25.5 6 403 23.5 3 298 20 7 265 21 4 307 21.5
Summary statistics yield , and . Test to determine if a linear relationship exists between the gestation period and the length of life of a horse. Use and use as an estimate of .
(Essay)
4.8/5 (33)
In team-teaching, two or more teachers lead a class. A researcher tested the use of team-teaching in mathematics education. Two of the variables measured on each teacher in a sample of 169 mathematics teachers were years of teaching experience x and reported success rate y (measured as a percentage) of team-teaching mathematics classes. The correlation coefficient for the sample data was reported as r = -0.34. Interpret this result.
(Essay)
4.7/5 (36)
To investigate the relationship between yield of potatoes, y, and level of fertilizer application, x, a researcher divides a field into eight plots of equal size and applies differing amounts of fertilizer to each. The yield of potatoes (in pounds) and the fertilizer application (in pounds) are recorded for each plot. The data are as follows: x 1 1.5 2 2.5 3 3.5 4 4.5 y 25 31 27 28 36 35 32 34
Summary statistics yield , and . Calculate the coefficient of correlation.
(Essay)
4.9/5 (32)
A realtor collected the following data for a random sample of ten homes that recently sold in her area. House Asking Price Days on Market A \ 114,500 29 B \ 149,900 16 C \ 154,700 59 D \ 159,900 42 E \ 160,000 72 F \ 165,900 45 G \ 169,700 12 H \ 171,900 39 I \ 175,000 81 J \ 289,900 121 a. Construct a scattergram for the data. b. Find the least squares line for the data and plot the line on your scattergram. c. Test whether the number of days on the market, y, is positively linearly related to the asking price, x. Use α = .05.
(Essay)
4.7/5 (27)
Consider the following pairs of measurements: x 1 3 4 6 7 y 3 6 8 12 13 a. Construct a scattergram for the data. b. What does the scattergram suggest about the relationship between x and y? c. Find the least squares estimates of β0 and β1. d. Plot the least squares line on your scattergram. Does the line appear to fit the data well?
(Essay)
4.8/5 (32)
Consider the following pairs of observations: x 2 3 5 5 6 y 1.3 1.6 2.1 2.2 2.7 Find and interpret the value of the coefficient of correlation.
(Essay)
4.9/5 (27)
A breeder of Thoroughbred horses wishes to model the relationship between the gestation period and the length of life of a horse. The breeder believes that the two variables may follow a linear trend. The information in the table was supplied to the breeder from various thoroughbred stables across the state. Horse Gestation period x (days) Life Length y (years) Horse Gestation period x (days) Life Length y (years) 1 416 24 5 356 22 2 279 25.5 6 403 23.5 3 298 20 7 265 21 4 307 21.5
Summary statistics yield , and . Find a prediction interval for the length of life of a horse that had a gestation period of 300 days. Use as an estimate of and use
(Essay)
4.8/5 (35)
The equation for a (deterministic) straight line is . If the line passes through the points (1, 6 ) and , find the values of and , respectively.
(Essay)
4.8/5 (37)
In team-teaching, two or more teachers lead a class. An researcher tested the use of team-teaching in mathematics education. Two of the variables measured on each sample of 177 mathematics teachers were years of teaching experience x and reported success rate y (measured as a percentage) of team-teaching mathematics classes. a. The researcher hypothesized that mathematics teachers with more years of experience will report higher perceived success rates in team-taught classes. State this hypothesis in terms of the parameter of a linear model relating x to y. b. The correlation coefficient for the sample data was reported as r = -0.3. Interpret this result. c. Does the value of r support the hypothesis? Test using α = .05.
(Essay)
4.8/5 (41)
Is the number of games won by a major league baseball team in a season related to the team's batting average? Data from 14 teams were collected and the summary statistics yield:
Assume . Estimate and interpret the estimate of .
(Essay)
4.8/5 (37)
Filters
- Essay(0)
- Multiple Choice(0)
- Short Answer(0)
- True False(0)
- Matching(0)