Exam 19: Statistical Applications in Quality Management
Exam 1: Defining and Collecting Data200 Questions
Exam 2: Organizing and Visualizing189 Questions
Exam 3: Numerical Descriptive Measures80 Questions
Exam 4: Basic Probability108 Questions
Exam 5: Discrete Probability Distributions81 Questions
Exam 6: Conthe Tinuonormausl Disdis Tributionstribution and Other38 Questions
Exam 7: Sampling Distributions62 Questions
Exam 8: Confidence Interval Estimation139 Questions
Exam 9: Fundamentals of Hypothesis Testing: One-Sample Tests133 Questions
Exam 10: Two-Sample Tests95 Questions
Exam 11: Analysis of Variance73 Questions
Exam 12: Chi-Square and Nonparametric100 Questions
Exam 13: Simple Linear Regression89 Questions
Exam 14: Introduction to Multiple113 Questions
Exam 15: Multiple Regression62 Questions
Exam 16: Time-Series Forecasting61 Questions
Exam 17: Business Analytics102 Questions
Exam 18: A Roadmap for Analyzing Data133 Questions
Exam 19: Statistical Applications in Quality Management86 Questions
Exam 20: Decision Making121 Questions
Select questions type
SCENARIO 19-4 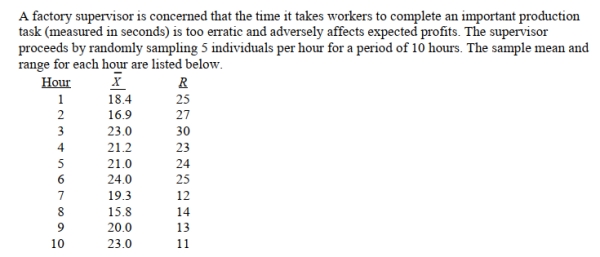 She also decides that lower and upper specification limit for the critical-to-quality variable should be
10 and 30 seconds, respectively.
-Referring to Scenario 19-4, suppose the sample mean and range data were based on 6
Observations per hour instead of 5.How would this change affect the lower and upper control
Limits of an R chart?
She also decides that lower and upper specification limit for the critical-to-quality variable should be
10 and 30 seconds, respectively.
-Referring to Scenario 19-4, suppose the sample mean and range data were based on 6
Observations per hour instead of 5.How would this change affect the lower and upper control
Limits of an R chart?
(Multiple Choice)
4.8/5  (26)
(26)
Variation signaled by individual fluctuations or patterns in the data is called
(Multiple Choice)
4.8/5 (31)
True or False: Total Productive Maintenance focuses on preventing the causes of defects.
(True/False)
4.7/5 (30)
True or False: The SS method establishes ways to eliminate unnecessary housekeeping aspects
of a work environment.
(True/False)
4.7/5 (27)
True or False: A process capability is estimated by the percentage of product or service that fall
outside the specification limits.
(True/False)
4.7/5 (32)
The principal focus of the control chart is the attempt to separate special or assignable causes of
Variation from common causes of variation.Which causes of variation can be reduced only by
Changing the system?
(Multiple Choice)
4.9/5 (38)
True or False: A master black belt is among the tools of Lean Six Sigma.
(True/False)
4.8/5 (36)
SCENARIO 19-1 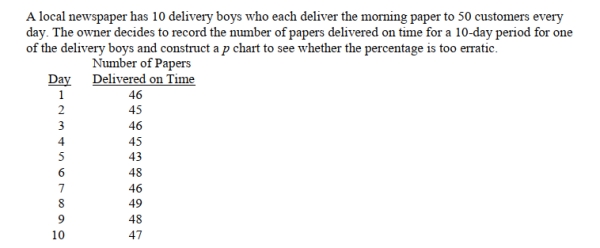 -Referring to Scenario 19-1, what is the numerical value of the center line for the p chart?
(Multiple Choice)
4.9/5 (39)
True or False: Mistake Proofing devices focus on methods that enable participants to reduce
setup time for equipment and resources and materials needed for changeover.
(True/False)
4.8/5 (35)
SCENARIO 19-4 She also decides that lower and upper specification limit for the critical-to-quality variable should be
10 and 30 seconds, respectively.
-Referring to Scenario 19-4, suppose the supervisor constructs an R chart to see if the variability in
Collection times is in-control.This R chart is characterized by which of the following?
(Multiple Choice)
4.9/5 (39)
SCENARIO 19-1
-Referring to Scenario 19-1, what is the numerical value of the upper control limit for the p chart?
(Multiple Choice)
4.7/5 (32)
Which of the following is a method for breaking process into a series of steps in order to
Eliminate defects and produce near perfect results?
(Multiple Choice)
5.0/5 (40)
True or False: The purpose of a control chart is to eliminate common cause variation.
(True/False)
5.0/5 (28)
True or False: Quick Changeover Techniques establish ways to eliminate unnecessary
housekeeping aspects of a work environment.
(True/False)
4.7/5 (39)
True or False: The focus of Lean Six Sigma is on removing non-value added steps and waste
which can exist in any part of an organization.
(True/False)
4.8/5 (30)
True or False: Quick Changeover Techniques establish ways to clean and maintain the
necessary housekeeping aspects of a work environment.
(True/False)
4.8/5 (32)
True or False: The CPL and CPU indexes are used to measure process' actual performance
rather than its potential.
(True/False)
4.7/5 (42)
SCENARIO 19-3 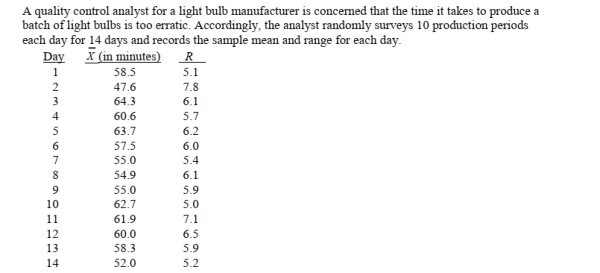 -Referring to Scenario 19-3, suppose the analyst constructs an R chart to see if the variability in
Production times is in-control.What is the upper control limit for this R chart?
-Referring to Scenario 19-3, suppose the analyst constructs an R chart to see if the variability in
Production times is in-control.What is the upper control limit for this R chart?
(Multiple Choice)
4.9/5 (38)
SCENARIO 19-3
-Referring to Scenario 19-3, suppose the analyst constructs an  chart to see if the production
Process is in-control.Which expression best describes this chart?
chart to see if the production
Process is in-control.Which expression best describes this chart?
(Multiple Choice)
4.8/5 (37)
Filters
- Essay(0)
- Multiple Choice(0)
- Short Answer(0)
- True False(0)
- Matching(0)