Exam 19: Statistical Applications in Quality Management
Exam 1: Defining and Collecting Data200 Questions
Exam 2: Organizing and Visualizing189 Questions
Exam 3: Numerical Descriptive Measures80 Questions
Exam 4: Basic Probability108 Questions
Exam 5: Discrete Probability Distributions81 Questions
Exam 6: Conthe Tinuonormausl Disdis Tributionstribution and Other38 Questions
Exam 7: Sampling Distributions62 Questions
Exam 8: Confidence Interval Estimation139 Questions
Exam 9: Fundamentals of Hypothesis Testing: One-Sample Tests133 Questions
Exam 10: Two-Sample Tests95 Questions
Exam 11: Analysis of Variance73 Questions
Exam 12: Chi-Square and Nonparametric100 Questions
Exam 13: Simple Linear Regression89 Questions
Exam 14: Introduction to Multiple113 Questions
Exam 15: Multiple Regression62 Questions
Exam 16: Time-Series Forecasting61 Questions
Exam 17: Business Analytics102 Questions
Exam 18: A Roadmap for Analyzing Data133 Questions
Exam 19: Statistical Applications in Quality Management86 Questions
Exam 20: Decision Making121 Questions
Select questions type
SCENARIO 19-4 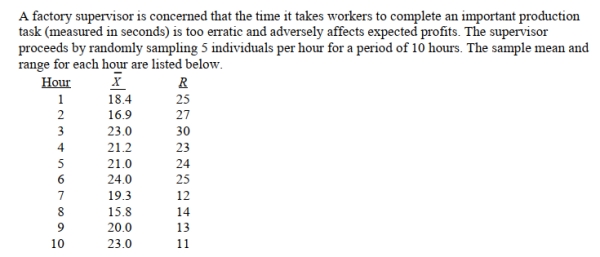 She also decides that lower and upper specification limit for the critical-to-quality variable should be
10 and 30 seconds, respectively.
-Referring to Scenario 19-4, suppose the supervisor constructs an R chart to see if the variability in
Collection times is in-control.What are the lower and upper control limits for this R chart?
She also decides that lower and upper specification limit for the critical-to-quality variable should be
10 and 30 seconds, respectively.
-Referring to Scenario 19-4, suppose the supervisor constructs an R chart to see if the variability in
Collection times is in-control.What are the lower and upper control limits for this R chart?
(Multiple Choice)
4.8/5  (32)
(32)
True or False: SMED establishes ways to eliminate unnecessary housekeeping aspects of a
work environment.
(True/False)
4.8/5 (49)
SCENARIO 19-3 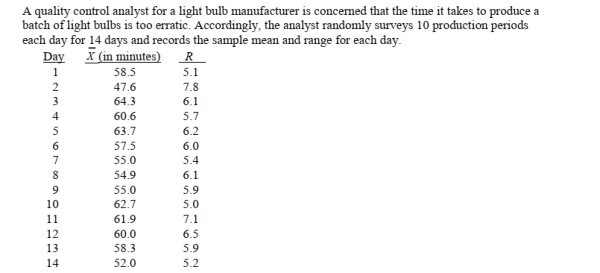 -Referring to Scenario 19-3, suppose the analyst constructs an
  chart to see if the production
Process is in-control.What is the center line for this chart?
chart to see if the production
Process is in-control.What is the center line for this chart?
(Multiple Choice)
4.8/5 (34)
True or False: The smaller the capability index, the more capable a process is of meeting
customer requirements.
(True/False)
4.8/5 (37)
True or False: The R chart is a control chart used to monitor a process mean.
(True/False)
4.9/5 (38)
True or False: The control limits are based on the standard deviation of the process.
(True/False)
4.9/5 (28)
True or False: An in-control process must be achieved before being able to estimate process
capability.
(True/False)
4.7/5 (30)
Once the control limits are set for a control chart, one attempts to
(Multiple Choice)
4.9/5 (35)
True or False: The SS method establishes ways to clean and maintain the necessary
housekeeping aspects of a work environment.
(True/False)
4.8/5 (29)
_______ causes of variation are correctable without modifying the system.
(Essay)
4.9/5 (33)
True or False: Total Productive Maintenance focuses on methods that enable participants to
reduce setup time for equipment and resources and materials needed for changeover.
(True/False)
4.9/5 (36)
True or False: Poke-Yoke devices establish ways to clean and maintain the necessary
housekeeping aspects of a work environment.
(True/False)
4.7/5 (39)
SCENARIO 19-1 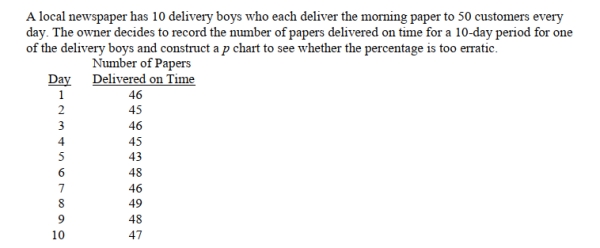 -Referring to Scenario 19-1, what is the numerical value of the lower control limit for the p chart?
(Multiple Choice)
4.8/5 (41)
Variation due to the inherent variability in a system of operation is called
(Multiple Choice)
4.9/5 (36)
SCENARIO 19-2 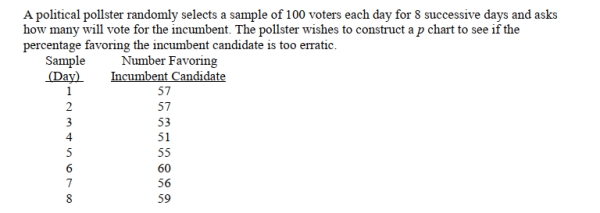 -Referring to Scenario 19-2, what is the numerical value of the upper control limit for the p chart?
(Multiple Choice)
4.9/5 (42)
SCENARIO 19-3
-Referring to Scenario 19-3, suppose the analyst constructs an  chart to see if the production
Process is in-control.What is the upper control limit (UCL)for this chart?
chart to see if the production
Process is in-control.What is the upper control limit (UCL)for this chart?
(Multiple Choice)
4.8/5 (31)
SCENARIO 19-3
-Referring to Scenario 19-3, suppose the analyst constructs an R chart to see if the variability in
Production times is in-control.What is the lower control limit for this R chart?
(Multiple Choice)
4.9/5 (45)
Filters
- Essay(0)
- Multiple Choice(0)
- Short Answer(0)
- True False(0)
- Matching(0)