Exam 14: Nonparametric Statistics Available Online
Exam 1: Statistics, Data, and Statistical Thinking77 Questions
Exam 2: Methods for Describing Sets of Data187 Questions
Exam 3: Probability284 Questions
Exam 4: Discrete Random Variables134 Questions
Exam 5: Continuous Random Variables138 Questions
Exam 6: Sampling Distributions52 Questions
Exam 7: Inferences Based on a Single Sample: Estimation With Confidence Intervals125 Questions
Exam 8: Inferences Based on a Single144 Questions
Exam 9: Inferences Based on Two Samples: Confidence Intervals and Tests of Hypotheses100 Questions
Exam 10: Analysis of Variance: Comparing More Than Two Means91 Questions
Exam 11: Simple Linear Regression113 Questions
Exam 12: Multiple Regression and Model Building131 Questions
Exam 13: Categorical Data Analysis60 Questions
Exam 14: Nonparametric Statistics Available Online87 Questions
Select questions type
The final exam scores of 10 randomly selected statistics students and the number of hours they studied for the exam are given below. Can you conclude that there is a correlation between the scores on the test and the times spent studying? Use .
Hours 2 4 1 7 1 3 3 4 5 2 Scores 64 79 59 87 65 77 84 89 89 70
(Essay)
4.9/5  (29)
(29)
The only assumption necessary to ensure the validity of the sign test is that the probability
distribution of measurements is continuous.
(True/False)
4.8/5 (47)
The grade point averages of students participating in sports at a college are to be compared. The data are listed below. Use the Kruskal-Wallis test to test the claim that there is no difference in the distribution of the populations. Use .
Tennis Golf Swimming 3.0 1.6 2.5 2.4 1.9 2.8 2.3 3.1 2.6 3.3 1.7 2.3 2.9 2.1 2.3 19 1.8 2.2
(Essay)
4.9/5 (44)
Consider the data set shown below. Find the rejection region for determining if the Spearman's Rank Correlation between the variables and y exceeds 0. Use .
0 4 2 3 8 10 11 -2 0 2 4 6 8 10
(Multiple Choice)
4.9/5 (33)
Eight SmartCars were randomly selected and the highway mileage of each was noted. The highway mileage per gallon for each car is shown below: 32 42 29 34 41 37 38 39 40
It was desired to determine if the median miles per gallon of all SmartCars exceeded 35 miles per gallon. Identify the test statistic that should be used when conducting the Sign Test.
(Multiple Choice)
4.8/5 (45)
Nine students took the SAT test. Their scores are listed below. Later, they took a test preparation course and retook the SAT. Their new scores are listed below. Use the Wilcoxon signed rank test to test the claim that the test preparation had no effect on their scores. Use .
Student 1 2 3 4 5 6 7 8 9 Before Score 950 1130 920 810 1160 830 840 970 870 After Score 970 1130 910 850 1190 840 830 1010 890
(Essay)
4.7/5 (37)
Specify the rejection region for the Wilcoxon rank sum test in the following situation.
: Two probability distributions, 1 and 2, are identical
: Probability distribution of population 1 is shifted to the right or left of the probability distribution for population 2
(Essay)
4.9/5 (39)
Six patients were each given four different pain killers and asked to rate each pain killer's effectiveness in reducing pain on a scale of 1 to 10 . A Friedman -test was performed on the results. A printout is shown below.
Friedman Test: Response versus Treatment blocked by Patient
Treatment Est Sum of 1 6 7.500 24.0 2 6 4.500 12.0 3 6 6.000 18.0 4 6 2.500 6.0
Grand median Is there evidence that at least two of the treatment probability distributions differ in
location? Explain.
(Essay)
4.7/5 (31)
A scientist is hoping to compare the levels of DDT toxin found in three species of fish in a local river. He randomly samples 7 of each species to use in the analysis. For each fish, he measures the
Amount of DDT toxin present. The data is shown below: 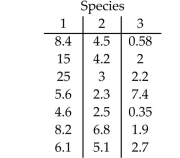 Ideally he will be able to determine if a difference exists in the population of DDT toxins found in the three fish species. Identify the test statistic for the Kruskal-Wallis H-Test.
(Multiple Choice)
4.8/5 (35)
The drama department at a college asked professors and students in the drama department to rank 8 actors according to their performance. The data are listed below. A 10 is the highest ranking and a 1 the lowest ranking. Test the claim of no correlation between the rankings. Use .
Actor 1 2 3 4 5 6 7 8 Professors 2 3 6 10 8 1 5 4 Students 43145796
(Essay)
5.0/5 (45)
A realtor wishes to compare the square footage of houses in 4 different cities, all of which
are priced approximately the same. The data are listed below. Use the Kruskal-Wallis test
to test the claim that there is no difference in the distribution of the populations. Use \alpha=.05 City 1 City 2 City 3 City 4 2850 2480 2230 3100 2680 2240 2370 3050 2700 2390 2280 3300 2910 2350 2300 2850 2600 2400 2200 2700 2750 2450 2900 2350 3050 2950
(Essay)
4.9/5 (28)
The number of absences and the final grades of 9 randomly selected students from a statistics class are given below. Can you conclude that there is a correlation between the final grade and the number of absences? Use .
Number of Absences 0 3 6 4 9 2 15 8 5 Final Grade 98 86 80 82 71 92 55 76 82
(Essay)
4.9/5 (45)
Fading of wood is a problem with wooden decks on boats. Three varnishes used to retard this aging process were tested to see whether there were any differences among them. Samples of 10 different types of wood were treated with each of the three varnishes and the amount of fading was measured after three months of exposure to the sun. The data are listed below. Is there evidence of a difference in the probability distributions of the amounts of fading among the three types of varnish? Use .
Varnish Sample 1 2 3 1 3.8 3.4 4.1 2 6.4 5.6 6.2 3 2.6 2.7 2.6 4 5.4 4.5 5.1 5 7.6 6 7 6 4.8 4 4.9 7 2.9 2.9 3.3 8 5.3 5.4 5.6 9 4.1 3.3 3.4 10 4.4 4.2 4.3
(Essay)
4.9/5 (38)
A researcher wishes to determine whether there is a difference in the average age of elementary school, high school, and community college teachers. Teachers are randomly selected. Their ages are recorded below. Use the Kruskal-Wallis -test to test the claim that there is no difference in the distribution of the populations. Use .
Elementary School Teachers High School Teachers Community College Teachers 6 45 48 37 50 54 36 47 45 61 56 70 46 51 54 34 40 44
(Essay)
4.8/5 (36)
For the Wilcoxon rank sum test to be valid, the number of ties in the measurements needs to be
small relative to the sample sizes.
(True/False)
4.8/5 (36)
For a valid Friedman -test, the probability distributions from which the samples within each block are drawn must be continuous.
(True/False)
4.8/5 (35)
In a study comparing the effects of four energy drinks on running speed, eight runners were timed (in seconds) running four miles. On each day, they were given a single energy drink. The data are listed below. Is there evidence of a difference in the probability distributions of the running times among the four drinks? Use .
Drink Runner 1 2 3 4 1 1229 1230 1277 1248 2 1133 1039 1155 1163 3 1233 1361 1295 1307 4 1260 1221 1276 1271 5 1163 1125 1219 1224 6 1322 1299 1352 1348 7 1224 1265 1261 1247 8 1247 1138 1275 1252
(Essay)
4.8/5 (33)
Four brands of baseball bats were tested to determine which bat allowed hitters to hit a baseball farthest. Eight different batters were thrown 25 pitches while hitting with each of the four bats
(assigned in random order). The median distance of the five longest hits using each bat is shown in
The table below. The goal is to determine if a difference exists in the population of median
Distances for each of the four brands of baseball bat. Batter Brand 1 Brand 2 Brand 3 Brand 4 1 307 315 300 275 2 310 317 305 285 3 335 335 335 302 4 325 328 320 300 5 300 305 295 270 6 345 350 340 310 7 312 315 308 300 8 298 302 295 288
Use the Friedman Test and find the rejection region used to determine if at least two of the distance distributions for the four baseball bats differ in location. Use .
(Multiple Choice)
4.9/5 (37)
When performing a signed rank test in a paired difference experiment, tied absolute value
differences are assigned the average of the ranks they would receive if they were unequal, but
successive measurements.
(True/False)
4.8/5 (34)
Independent random samples from two populations are shown in the table. 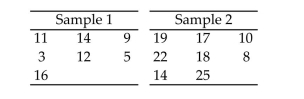 Use the Wilcoxon rank sum test to determine whether the data provide sufficient evidence to indicate a shift in the locations of the probability distributions of the sampled populations. Use .
(Essay)
4.7/5 (40)
Filters
- Essay(0)
- Multiple Choice(0)
- Short Answer(0)
- True False(0)
- Matching(0)