Exam 9: Inferences Based on Two Samples: Confidence Intervals and Tests of Hypotheses
Exam 1: Statistics, Data, and Statistical Thinking77 Questions
Exam 2: Methods for Describing Sets of Data187 Questions
Exam 3: Probability284 Questions
Exam 4: Discrete Random Variables134 Questions
Exam 5: Continuous Random Variables138 Questions
Exam 6: Sampling Distributions52 Questions
Exam 7: Inferences Based on a Single Sample: Estimation With Confidence Intervals125 Questions
Exam 8: Inferences Based on a Single144 Questions
Exam 9: Inferences Based on Two Samples: Confidence Intervals and Tests of Hypotheses100 Questions
Exam 10: Analysis of Variance: Comparing More Than Two Means91 Questions
Exam 11: Simple Linear Regression113 Questions
Exam 12: Multiple Regression and Model Building131 Questions
Exam 13: Categorical Data Analysis60 Questions
Exam 14: Nonparametric Statistics Available Online87 Questions
Select questions type
An inventor has developed a new spray coating that is designed to improve the wear of bicycle tires. To test the new coating, the inventor randomly selects one of the two tires on each of 50
Bicycles to be coated with the new spray. The bicycle is then driven for 100 miles and the amount
Of the depth of the tread left on the two bicycle tires is measured (in millimeters). It is desired to
Determine whether the new spray coating improves the wear of the bicycle tires. The data and
Summary information is shown below: Bicycle Coated Tire (C) Non-Coated Tire (N) 1 1.452 0.785 2 1.634 0.844 1 1 1 50 1.211 0.954
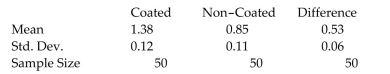 Use the summary data to construct a confidence interval for the difference between the means.
Free
(Multiple Choice)
4.9/5  (36)
(36)
Correct Answer: Verified
C
A researcher is investigating which of two newly developed automobile engine oils is better at prolonging the life of an engine. Since there are a variety of automobile engines, 20 different engine types were randomly selected and were tested using each of the two engine oils. The number of hours of continuous use before engine breakdown was recorded for each engine oil. Suppose the following confidence interval for was calculated: . Which of the following inferences is correct?
Free
(Multiple Choice)
4.9/5 (38)
Correct Answer:Verified
B
In an exit poll, 42 of 75 men sampled supported a ballot initiative to raise the local sales tax
to build a new football stadium. In the same poll, 41 of 85 women sampled supported the
initiative. Find and interpret the p-value for the test of hypothesis that the proportions of
men and women who support the initiative are different.
Free
(Essay)
4.8/5 (42)
Correct Answer:Verified
and ; The test statistic is
The -value is . The probability of observing a value of more contradictory to the null hypothesis is . 3124 .
Suppose you want to estimate the difference between two population means correct to within 2.5 with probability 0.95. If prior information suggests that the population variances are both equal to
The value 20, and you want to select independent random samples of equal size from the
Populations, how large should the sample sizes be?
(Multiple Choice)
5.0/5 (34)
The sample standard deviation of differences is equal to the difference of the sample standard deviations .
(True/False)
4.7/5 (43)
Data were collected from CEOs in the consumer products industry and CEOs in the telecommunication industry. The data were analyzed using a software package in order to
Compare mean salaries of CEOs in the two industries. HYPOTHESIS: MEAN X = MEAN Y
SAMPLES SELECTED FROM SALARY
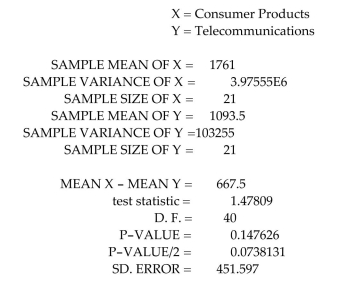 Find the -value for testing a two-tailed alternative hypothesis.
(Multiple Choice)
4.8/5 (35)
Determine whether the sample sizes are large enough to conclude that the sampling
distributions are approximately normal.
(Essay)
4.8/5 (45)
When blood levels are low at an area hospital, a call goes out to local residents to give blood. The blood center is interested in determining which sex - males or females - is more likely to respond Random, independent samples of 60 females and 100 males were each asked if they would be willing to give blood when called by a local hospital. A success is defined as a person who responds to the call and donates blood. The goal is to compare the percentage of the successes of the male and female responses. Find the rejection region that would be used if it is desired to test to determine if a difference exists between the proportion of the females and males who responds to the call to donate blood. Use .
(Multiple Choice)
4.8/5 (45)
Determine whether the sample sizes are large enough to conclude that the sampling
distributions are approximately normal.
(Essay)
4.8/5 (50)
A marketing study was conducted to compare the mean age of male and female purchasers of a certain product. Random and independent samples were selected for both male and female
Purchasers of the product. It was desired to test to determine if the mean age of all female
Purchasers exceeds the mean age of all male purchasers. The sample data is shown here:  Find the rejection region to state the correct conclusion when testing at alpha .
(Multiple Choice)
4.8/5 (33)
Data were collected from CEOs in the consumer products industry and the CEOs in the telecommunication industry. The data were analyzed using a software package in order to
Compare mean salaries of CEOs in the two industries. HYPOTHESIS: MEAN X = MEAN Y
SAMPLES SELECTED FROM SALARY
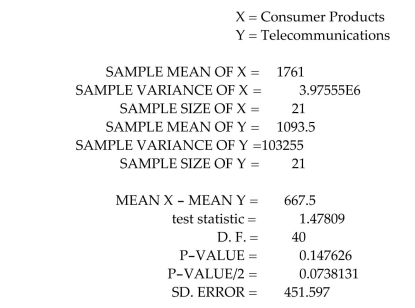 Using , give the rejection region for a two-tailed test.
(Multiple Choice)
4.9/5 (36)
Which supermarket has the lowest prices in town? All claim to be cheaper, but an independent agency recently was asked to investigate this question. The agency randomly selected 100 items
Common to each of two supermarkets (labeled A and B)and recorded the prices charged by each supermarket. The summary results are provided below:
=2.09 =1.99 =.10 =0.22 =0.19 sd=.03
Assuming the data represent a matched pairs design, calculate the confidence interval for comparing mean prices using a confidence level.
(Multiple Choice)
4.8/5 (38)
A marketing study was conducted to compare the mean age of male and female purchasers of a certain product. Random and independent samples were selected for both male and female
Purchasers of the product. It was desired to test to determine if the mean age of all female
Purchasers exceeds the mean age of all male purchasers. The sample data is shown here:  Use the pooled estimate of the population standard deviation to calculate the value of the test statistic to use in this test of hypothesis.
(Multiple Choice)
4.8/5 (40)
Independent random samples, each containing 1,000 observations were selected from two binomial populations. The samples from populations 1 and 2 produced 475 and 550 successes, respectively. Test against . Use .
(Essay)
4.9/5 (36)
A certain manufacturer is interested in evaluating two alternative manufacturing plans consisting of different machine layouts. Because of union rules, hours of operation vary greatly for this
Particular manufacturer from one day to the next. Twenty-eight random working days were
Selected and each plan was monitored and the number of items produced each day was recorded.
Some of the collected data is shown below: DAY PLAN 1 OUTPUT PLAN 2 OUTPUT 1 1234 units 1311 units 2 1355 units 1366 units 3 1300 units 1289 units What type of analysis will best allow the manufacturer to determine which plan is more effective?
(Multiple Choice)
4.8/5 (37)
Independent random samples of 100 observations each are chosen from two normal
populations with the following means and standard deviations. Population 1 Population 2 =15 =13 =3 =2
Find the mean and standard deviation of the sampling distribution of .
(Essay)
4.9/5 (41)
In order to compare the means of two populations, independent random samples of 144
observations are selected from each population with the following results. Sample 1 Sample 2 =7,123 =6,957 =175 =225
Use a confidence interval to estimate the difference between the population means . Interpret the confidence interval.
(Essay)
4.8/5 (28)
A paired difference experiment yielded the following results.
Test against , where , using .
(Essay)
4.8/5 (45)
Filters
- Essay(0)
- Multiple Choice(0)
- Short Answer(0)
- True False(0)
- Matching(0)