Exam 13: Categorical Data Analysis
Exam 1: Statistics, Data, and Statistical Thinking77 Questions
Exam 2: Methods for Describing Sets of Data187 Questions
Exam 3: Probability284 Questions
Exam 4: Discrete Random Variables134 Questions
Exam 5: Continuous Random Variables138 Questions
Exam 6: Sampling Distributions52 Questions
Exam 7: Inferences Based on a Single Sample: Estimation With Confidence Intervals125 Questions
Exam 8: Inferences Based on a Single144 Questions
Exam 9: Inferences Based on Two Samples: Confidence Intervals and Tests of Hypotheses100 Questions
Exam 10: Analysis of Variance: Comparing More Than Two Means91 Questions
Exam 11: Simple Linear Regression113 Questions
Exam 12: Multiple Regression and Model Building131 Questions
Exam 13: Categorical Data Analysis60 Questions
Exam 14: Nonparametric Statistics Available Online87 Questions
Select questions type
The -test for independence is a useful tool for establishing a causal relationship between two factors.
Free
(True/False)
4.9/5  (31)
(31)
Correct Answer: Verified
False
Describe probabilities of the k outcomes of the multinomial experiment trials.
Free
(Essay)
4.8/5 (35)
Correct Answer:Verified
The probabilities of the k outcomes remain the same from trial to trial and sum to 1.
What are characteristics of the trials in a multinomial experiment?
Free
(Essay)
4.9/5 (37)
Correct Answer:Verified
The trials are independent; there are k possible outcomes to each trial; the
experiment consists of n identical trials.
Inc. Technology reported the results of consumer survey in which 300 Internet users indicated their level of agreement with the following statement: ʺThe government needs to be able to scan
Internet messages and user communications to prevent fraud and other crimes.ʺ The possible
Responses were ʺagree stronglyʺ, ʺagree somewhatʺ, ʺdisagree somewhatʺ, and ʺdisagree stronglyʺ.
The number of Internet users in each category is summarized in the table. RESPONSE NUMBER Agree Strongly 60 Agree Somewhat 110 Disagree Somewhat 80 Disagree Strongly 50
In order to determine whether the true proportions of Internet users in each response category differ, a one-way chi-square analysis should be conducted. As part of that analysis, a confidence interval for the multinomial probability associated with the "Agree Strongly" response was desired. Which of the following confidence intervals should be used?
(Multiple Choice)
4.8/5 (34)
Inc. Technology reported the results of consumer survey in which 300 Internet users indicated their level of agreement with the following statement: ʺThe government needs to be able to scan
Internet messages and user communications to prevent fraud and other crimes.ʺ The possible
Responses were ʺagree stronglyʺ, ʺagree somewhatʺ, ʺdisagree somewhatʺ, and ʺdisagree stronglyʺ.
The number of Internet users in each category is summarized in the table. RESPONSE NUMBER Agree Strongly 60 Agree Somewhat 110 Disagree Somewhat 80 Disagree Strongly 50
In order to determine whether the true proportions of Internet users in each response category differ, a one-way chi-square analysis should be conducted. Calculate the value of the test statistic for the desired analysis.
(Multiple Choice)
4.8/5 (39)
Inc. Technology reported the results of consumer survey in which 300 Internet users indicated their level of agreement with the following statement: ʺThe government needs to be able to scan
Internet messages and user communications to prevent fraud and other crimes.ʺ The possible
Responses were ʺagree stronglyʺ, ʺagree somewhatʺ, ʺdisagree somewhatʺ, and ʺdisagree stronglyʺ.
The number of Internet users in each category is summarized in the table. RESPONSE NUMBER Agree Strongly 60 Agree Somewhat 110 Disagree Somewhat 80 Disagree Strongly 50
Specify the null hypothesis for testing whether the true proportions of Internet users in each response category are equal.
(Multiple Choice)
4.8/5 (30)
A teacher finds that final grades in the statistics department are distributed as: A, 25\%; B, 25\%; C, ; D, . At the end of a randomly selected semester, the following grades were recorded. Find the rejection region used to determine if the grade distribution for the department is different than expected. Use .
Grade A B C D F Number 36 42 60 8 14
(Multiple Choice)
4.8/5 (31)
A coffeehouse wishes to see if customers have any preference among 5 different brands of coffee. A sample of 200 customers provided the data below. Find the rejection region used to test the claim that the probabilities show no preference. Use .
Brand 1 2 3 4 5 Customers 32 65 18 55 30
(Multiple Choice)
4.9/5 (39)
Use the appropriate table to find the following chi-square value: for .
(Multiple Choice)
4.7/5 (31)
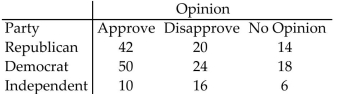
The contingency table below shows the results of a random sample of 200 state
representatives that was conducted to see whether their opinions on a bill are related to
their party affiliations. Opinion Party Approve Disapprove No Opinion Republican 42 20 14 Democrat 50 24 18 Independent 10 16 6 Test the claim of independence. Use \alpha=.05 .
(Essay)
4.8/5 (36)
Find the rejection region for a one-dimensional chi-square test of a null hypothesis concerning if and .
(Multiple Choice)
4.9/5 (35)
The contingency table below shows the results of a random sample of 200 state representatives that was conducted to see whether their opinions on a bill are related to their party affiliation. Opinion Party Approve Disapprove No Opinion Republican 42 20 14 Democrat 50 24 18 Independent 10 16 6
Find the chi-square test statistic used to test the claim of independence.
(Multiple Choice)
4.9/5 (33)
The contingency table below shows the results of a random sample of 200 state representatives that was conducted to see whether their opinions on a bill are related to their party affiliations.
Assuming the row and column classifications are independent, find an estimate for the expected cell count .
(Multiple Choice)
4.8/5 (30)
A sports researcher is interested in determining if there is a relationship between the number of home team and visiting team wins and different sports. A random sample of 526 games is selected and the results are given below. Find the rejection region used to test the claim that the number of home team and visiting team wins is independent of the sport. Use .
Football Basketball Soccer Baseball Home team wins 39 156 25 83 Visiting team wins 31 98 19 75
(Multiple Choice)
4.7/5 (38)
A random sample of 160 car accidents are selected and categorized by the age of the driver determined to be at fault. The results are listed below. The age distribution of drivers for the given categories is for the under 26 group, for the group, for the group, and for the group over 65 . Test the claim that all ages have crash rates proportional to their number of drivers. Use .
Age Under 26 26-45 46-65 Over 65 Drivers 66 39 25 30
(Essay)
4.9/5 (32)
In a test of independence, it is safe to conclude that the events are independent when the value of is very small.
(True/False)
4.8/5 (43)
Inc. Technology reported the results of consumer survey in which 300 Internet users indicated their level of agreement with the following statement: ʺThe government needs to be able to scan
Internet messages and user communications to prevent fraud and other crimes.ʺ The possible
Responses were ʺagree stronglyʺ, ʺagree somewhatʺ, ʺdisagree somewhatʺ, and ʺdisagree stronglyʺ.
The number of Internet users in each category is summarized in the table. RESPONSE NUMBER Agree Strongly 60 Agree Somewhat 110 Disagree Somewhat 80 Disagree Strongly 50
In order to determine whether the true proportions of Internet users in each response category differ, a one-way chi-square analysis should be conducted. When calculating the test statistic, what values for the expected counts should be used in the calculation?
(Multiple Choice)
4.9/5 (34)
Test the null hypothesis of independence of the two classifications, and , of the contingency table shown below. Test using .
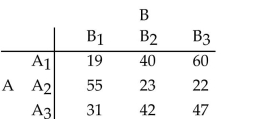
(Essay)
4.8/5 (32)
A multinomial experiment with k = 3 cells and n =30 has been conducted and the results
are shown in the table. 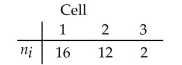 Explain why the sample size is not large enough to test whether , and .
(Essay)
4.9/5 (33)
Filters
- Essay(0)
- Multiple Choice(0)
- Short Answer(0)
- True False(0)
- Matching(0)