Exam 8: Inferences Based on a Single
Exam 1: Statistics, Data, and Statistical Thinking77 Questions
Exam 2: Methods for Describing Sets of Data187 Questions
Exam 3: Probability284 Questions
Exam 4: Discrete Random Variables134 Questions
Exam 5: Continuous Random Variables138 Questions
Exam 6: Sampling Distributions52 Questions
Exam 7: Inferences Based on a Single Sample: Estimation With Confidence Intervals125 Questions
Exam 8: Inferences Based on a Single144 Questions
Exam 9: Inferences Based on Two Samples: Confidence Intervals and Tests of Hypotheses100 Questions
Exam 10: Analysis of Variance: Comparing More Than Two Means91 Questions
Exam 11: Simple Linear Regression113 Questions
Exam 12: Multiple Regression and Model Building131 Questions
Exam 13: Categorical Data Analysis60 Questions
Exam 14: Nonparametric Statistics Available Online87 Questions
Select questions type
A large university is interested in learning about the average time it takes students to drive to campus. The university sampled 51 students and asked each to provide the amount of time they spent traveling to campus. The sample results found that the sample mean was minutes and the sample standard deviation was minutes. Find the rejection region for determining if the population standard deviation exceeds 20 minutes. Use .
Free
(Multiple Choice)
4.7/5  (31)
(31)
Correct Answer: Verified
C
It is desired to test against using . The population in question is uniformly distributed with a standard deviation of 10 . A random sample of 36 will be drawn from this population. If is really equal to 35 , what is the probability that the hypothesis test would lead the investigator to commit a Type II error?
Free
(Multiple Choice)
4.8/5 (39)
Correct Answer:Verified
D
The business college computing center wants to determine the proportion of business students who have laptop computers. If the proportion differs from 30%, then the lab will modify a
Proposed enlargement of its facilities. Suppose a hypothesis test is conducted and the test statistic
Is 2.5. Find the p-value for a two-tailed test of hypothesis.
Free
(Multiple Choice)
4.9/5 (34)
Correct Answer:Verified
D
For the given rejection region, sketch the sampling distribution for z and indicate the location of the rejection region.
-z < -1.28
(Essay)
4.7/5 (43)
A supermarket sells rotisserie chicken at a fixed price per chicken rather than by the
weight of the chicken. The store advertises that the average weight of their chickens is 4.6
pounds. A random sample of 30 of the storeʹs chickens yielded the weights (in pounds)
shown below. 4.4 4.7 4.6 4.4 4.5 4.3 4.6 4.5 4.6 4.9 4.6 4.8 4.3 4.4 4.7 4.5 4.2 4.3 4.1 4.0 4.5 4.6 4.2 4.4 4.7 4.8 5.0 4.2 4.1 4.5
Test whether the population mean weight of the chickens is less than pounds. Use .
(Essay)
5.0/5 (40)
A small private college is interested in determining the percentage of its students who live off campus and drive to class. Specifically, it was desired to determine if less than of their current students live off campus and drive to class. Suppose a sample of 108 students produced a test statistic of . Find the -value for the test of interest to the college.
(Multiple Choice)
4.8/5 (29)
It has been estimated that the G-car obtains a mean of 35 miles per gallon on the highway, and the company that manufactures the car claims that it exceeds this estimate in highway driving. To support its assertion, the company randomly selects -cars and records the mileage obtained for each car over a driving course similar to that used to obtain the estimate. The following data resulted: miles per gallon, miles per gallon. Calculate the value of if the true value of the mean is 37 miles per gallon. Use .
(Essay)
4.8/5 (46)
An educational testing service designed an achievement test so that the range in student
scores would be greater than 300 points. To determine whether the objective was
achieved, the testing service gave the test to a random sample of 52 students and found
that the sample mean and variance were 733 and 2255, respectively. Specify the null and
alternative hypotheses for determining whether the test achieved the desired dispersion in
scores. Assume that range
(Essay)
4.9/5 (36)
For the given binomial sample size and null-hypothesized value of determine whether the sample size is large
enough to use the normal approximation methodology to conduct a test of the null hypothesis
-
(Multiple Choice)
4.8/5 (29)
It is desired to test against using . The population in question is uniformly distributed with a standard deviation of 15. A random sample of 49 will be drawn from this population. If is really equal to 48 , what is the probability that the hypothesis test would lead the investigator to commit a Type II error?
(Multiple Choice)
4.8/5 (49)
State University uses thousands of fluorescent light bulbs each year. The brand of bulb it currently uses has a mean life of 1000 hours. A competitor claims that its bulbs, which cost the same as the brand the university currently uses, have a mean life of more than 1000 hours. The university has decided to purchase the new brand if, when tested, the evidence supports the manufacturer's claim at the .01 significance level. Suppose 92 bulbs were tested with the following results: hours, hours. Find the rejection region for the test of interest to the State University.
(Essay)
4.9/5 (28)
A consumer product magazine recently ran a story concerning the increasing prices of digital cameras. The story stated that digital camera prices dipped a couple of years ago, but now are beginning to increase in price because of added features. According to the story, the average price of all digital cameras a couple of years ago was . A random sample of cameras was recently taken and entered into a spreadsheet. It was desired to test to determine if that average price of all digital cameras is now more than . Find a rejection region appropriate for this test if we are using .
(Multiple Choice)
4.7/5 (41)
The null hypothesis represents the status quo to the party performing the sampling experiment.
(True/False)
4.8/5 (40)
A supermarket sells rotisserie chicken at a fixed price per chicken rather than by the
weight of the chicken. The store advertises that the average weight of their chickens is 4.6
pounds. A random sample of 30 of the storeʹs chickens yielded the weights (in pounds)
shown below. 4.4 4.7 4.6 4.4 4.5 4.3 4.6 4.5 4.6 4.9
4.6 4.8 4.3 4.4 4.7 4.5 4.2 4.3 4.1 4.0
4.5 4.6 4.2 4.4 4.7 4.8 5.0 4.2 4.1 4.5
Find and interpret the -value in a test of against .
(Essay)
4.8/5 (34)
A revenue department is under orders to reduce the time small business owners spend filling out pension form . Previously the average time spent on the form was 70 hours. In order to test whether the time to fill out the form has been reduced, a sample of 34 small business owners who annually complete the form was randomly chosen and their completion times recorded. The mean completion time for the sample was hours with a standard deviation of 30 hours. State the rejection region for the desired test at .
(Essay)
4.9/5 (33)
Data were collected from the sale of 25 properties by a local real estate agent. The following printout concentrated on the land value variable from the sampled properties. HYPOTHESIS: MEAN X
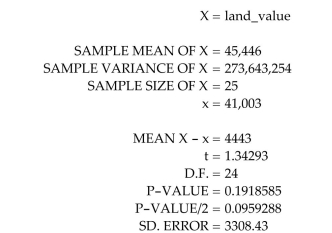 What is the correct conclusion when testing a greater-than alternative hypothesis at ?
(Multiple Choice)
4.8/5 (39)
A large university is interested in learning about the average time it takes students to drive to campus. The university sampled 238 students and asked each to provide the amount of time they
Spent traveling to campus. This variable, travel time, was then used to create a confidence interval
And to conduct a test of hypothesis, both of which are shown in the printout below. One-Sample Z Test
Null Hypothesis:
Alternative Hyp:
 Cases Included 238
What conclusion can be made from the test of hypothesis conducted in this printout? Begin each answer with, "When testing at ...
Cases Included 238
What conclusion can be made from the test of hypothesis conducted in this printout? Begin each answer with, "When testing at ...
(Multiple Choice)
4.7/5 (34)
A consumer product magazine recently ran a story concerning the increasing prices of digital cameras. The story stated that digital camera prices dipped a couple of years ago, but now are
Beginning to increase in price because of added features. According to the story, the average price
Of all digital cameras a couple of years ago was $215.00. A random sample of n = 200 cameras was
Recently taken and entered into a spreadsheet. It was desired to test to determine if that average
Price of all digital cameras is now more than $215.00. Find the large-sample rejection region
Appropriate for this test if we are using
(Multiple Choice)
4.7/5 (33)
Consider a test of . For the following case, give the rejection region for the test in terms of the -statistic:
(Multiple Choice)
4.9/5 (38)
Filters
- Essay(0)
- Multiple Choice(0)
- Short Answer(0)
- True False(0)
- Matching(0)