Exam 10: Analysis of Variance: Comparing More Than Two Means
Exam 1: Statistics, Data, and Statistical Thinking77 Questions
Exam 2: Methods for Describing Sets of Data187 Questions
Exam 3: Probability284 Questions
Exam 4: Discrete Random Variables134 Questions
Exam 5: Continuous Random Variables138 Questions
Exam 6: Sampling Distributions52 Questions
Exam 7: Inferences Based on a Single Sample: Estimation With Confidence Intervals125 Questions
Exam 8: Inferences Based on a Single144 Questions
Exam 9: Inferences Based on Two Samples: Confidence Intervals and Tests of Hypotheses100 Questions
Exam 10: Analysis of Variance: Comparing More Than Two Means91 Questions
Exam 11: Simple Linear Regression113 Questions
Exam 12: Multiple Regression and Model Building131 Questions
Exam 13: Categorical Data Analysis60 Questions
Exam 14: Nonparametric Statistics Available Online87 Questions
Select questions type
A counselor obtains SAT averages for incoming freshmen each year for a period covering 14 years, with the objective of determining the relationship between the SAT score and the year the test was
Given. The averages are then subjected to analysis for the purpose of drawing a conclusion
Regarding a trend. Determine whether the study is observational or designed.
Free
(Multiple Choice)
4.8/5  (44)
(44)
Correct Answer: Verified
B
An economist is investigating the impact of todayʹs economy on workers in the manufacturing industry who have been laid off. A sample of 50 workers was randomly selected from all workers
In manufacturing that have been laid off in the past year. The following variables were measured
For each laid off worker: length of time jobless (number of weeks)and tax status (single, married,
Or married/head of household). The data for the 50 workers were entered into the computer and
Analyzed to determine if the mean number of weeks jobless differed for the three tax status groups.
The Tukey multiple comparison printout is shown below: Tukey HSD All-Pairwise Comparisons Test of JOBLESS by STATUS
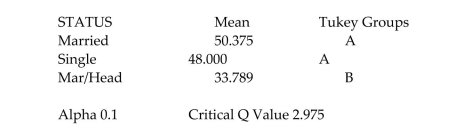 Give the population mean(s) which are in the statistically smallest group.
Free
(Multiple Choice)
4.9/5 (39)
Correct Answer:Verified
B
In an experiment with 10 treatments, how many pairs of means can be compared?
Free
(Multiple Choice)
4.7/5 (33)
Correct Answer:Verified
D
In a study to determine the least amount of time necessary to clean an SUV while maintaining a high quality standard, the owner of a chain of car washes designed an experiment where 20
Employees were divided into four groups, each with five members. Each member of each group
Was assigned an SUV to clean within a certain time limit. The time limits for the groups were 20
Minutes, 25 minutes, 30 minutes, and 35 minutes. After the time limits for each group had expired,
The owner inspected each SUV and rated the quality of the cleaning job on a scale of 1 to 10. What
Are the possible values of the response variable?
(Multiple Choice)
4.9/5 (31)
A local consumer reporter wants to compare the average costs of grocery items purchased at three different supermarkets, A, B, and C. Prices (in dollars)were recorded for a sample of 60 randomly
Selected grocery items at each of the three supermarkets. In order to reduce item-to-item
Variation, the prices were recorded for each item on the same day at each supermarket.  Identify the blocks for this experiment.
(Multiple Choice)
4.8/5 (38)
A multiple-comparison procedure for comparing four treatment means produced the confidence intervals shown below. Rank the means from smallest to largest. Use solid lines to connect those
Means which are not significantly different. - :(16,36) - :(7,23) - :(4,20) - :(-18,-4) - :(-20,-8) - :(-9,-2)
(Multiple Choice)
4.8/5 (33)
An appliance manufacturer is interested in determining whether the brand of laundry detergent used affects the average amount of dirt removed from standard household laundry loads. An
Experiment is set up in which 10 laundry loads are randomly assigned to each of four laundry
Detergents-Brands A, B, C, and D (a total of 40 loads in the experiment). The amount of dirt
Removed, y, (measured in milligrams)for each load is recorded and subjected to an ANOVA
Analysis, including a follow-up Tukey analysis. Which of the following inferences concerning the
Tukey results below is incorrect? Brands Sample Means B 184 D 172 A 143 C 131
(Multiple Choice)
4.7/5 (45)
Four brands of baseball bats were tested to determine which bat allowed hitters to hit a baseball farthest. Eight different batters were thrown 25 pitches while hitting with each of the four bats
(assigned in random order). The average distance of the five longest hits using each bat is shown
In the table below. The goal is to determine if the average hit distance differs for the four brands of
Baseball bats. Batter Brand 1 Brand 2 Brand 3 Brand 4 1 307 315 300 275 2 310 317 305 285 3 335 335 330 302 4 325 328 320 300 5 300 305 295 270 6 345 350 340 310 7 312 315 308 300 8 298 302 295 288
The ANOVA table output is shown here:
Source DF SS MS F P Batter 7 6227.4 946.77 39.70 0.0000 Brand 3 4117.6 1372.54 57.55 0.0000 Error 21 500.9 23.85 Total 31 11245.9
Based on the p-value for this test, make the proper conclusion about the treatments in this experiment.
(Multiple Choice)
4.8/5 (35)
An experiment was conducted to compare the mean iron content in iron ore pieces determined by three different methods: (1)mechanical, (2)manual, and (3)laser. Five 1-meter long pieces of iron
Ore were removed from a conveyor belt, and the iron content of each piece was determined using
Each of the three methods. The data are shown below. How should the data be analyzed? 
(Multiple Choice)
4.8/5 (35)
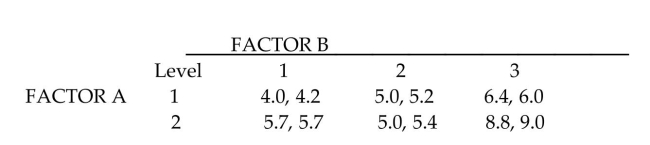 a. Calculate the mean response for each treatment b. The MINITAB ANOVA printout is shown here. Test for interaction at the leve of significance. Analysis of variance for response. Source df SS MS F A 1 0.53777 0.53777 0.11851 B 2 5.02708 2.51334 0.55391 AB 2 13.49334 6.74667 1.48678 Error 6 27.22667 4.53778 Total 11 46.28486 c. Does the result warrant tests of the two factor mean effects?
(Essay)
4.8/5 (36)
Suppose an experiment utilizing a random block design has 5 treatments and 11 blocks for a total of 55 observations. Assume that the total Sum of Squares for the response is (Total) . If the Sum of Squares for Treatments (SST) is of SS(Total), and the Sum of Squares for Blocks (SSB) is of SS (Total), find the values for this experiment.
(Multiple Choice)
4.7/5 (30)
An experiment was conducted using a randomized block design. The data from the
experiment are displayed in the following table. TREATMENT BLOCK 1 2 3 1 16 21 14 2 15 24 14 3 18 20 15
Fill in the missing entries for an ANOVA table.
SOURCE df SS MS F Treatments 86.22 Blocks Error
(Essay)
4.8/5 (32)
Psychologists have found that people are generally reluctant to transmit bad news to their peers. This phenomenon has been named the ʺMUM effect.ʺ To investigate the cause of the MUM effect,
40 undergraduates at a certain university participated in an experiment. Each subject was asked to
Administer an IQ test to another student and then provide the test taker with his or her percentile
Score. (Unknown to the subject, the test taker was a bogus student who was working with the
Researchers.)The experimenters manipulated two factors, subject visibility and success of test
Taker, each at two levels. Subject visibility was either visible or not visible to the test taker. Success
Of test taker was either top 20% or bottom 20%. Ten subjects were randomly assigned to each of the
2 x 2 = 4 experimental conditions, then the time (in seconds)between the end of the test and the
Delivery of the percentile score from the subject to the test taker was measured. (This variable is
Called the latency to feedback.)The data was subject to an analysis of variance, with the following
Results: Source df SS MS F PR > F Subject visibility 1 1380.24 1380.24 4.25 0.430 Test taker success 1 1325.16 1325.16 4.10 0.05 Visibility x success 1 3385.80 3385.80 10.45 .002 Error 36 11,664.00 324.00 Total 39 17,755.20
Which conclusion can you draw from the analysis? Use .
(Multiple Choice)
4.9/5 (39)
A multiple-comparison procedure for comparing four treatment means produced the confidence intervals shown below. For each pair of means, indicate which mean is larger or indicate that there
Is no significant difference. - :(18,34) - :(7,23) - :(6,18) - :(-17,-5) - :(-22,-6) - :(-13,7)
(Multiple Choice)
4.7/5 (40)
Four brands of baseball bats were tested to determine which bat allowed hitters to hit a baseball farthest. Eight different batters were thrown 25 pitches while hitting with each of the four bats
(assigned in random order). The average distance of the five longest hits using each bat is shown
In the table below. The goal is to determine if the average hit distance differs for the four brands of
Baseball bats. Batter Brand 1 Brand 2 Brand 3 Brand 4 1 307 315 300 275 2 310 317 305 285 3 335 335 330 302 4 325 328 320 300 5 300 305 295 270 6 345 350 340 310 7 312 315 308 300 8 298 302 295 288 A partial ANOVA table is shown below. Source DF SS MS F Batter 7 946.77 Brand 3 Error 21 500.9 Total 31 11245.9 Find the F-value in the table above for testing whether the average distance hit for the four brands
Of baseball bats differ.
(Multiple Choice)
4.8/5 (39)
A local consumer reporter wants to compare the average costs of grocery items purchased at three different supermarkets, A, B, and C. Prices (in dollars)were recorded for a sample of 60 randomly
Selected grocery items at each of the three supermarkets. In order to reduce item-to-item
Variation, the prices were recorded for each item on the same day at each supermarket.  Identify the treatments for this experiment.
(Multiple Choice)
4.8/5 (35)
Which of the following is not a condition required for a valid ANOVA F-test for a completely randomized experiment?
(Multiple Choice)
4.8/5 (33)
An industrial psychologist is investigating the effects of work environment on employee attitudes. A group of 20 recently hired sales trainees were randomly assigned to one of four different ʺhome
Roomsʺ- five trainees per room. Each room is identical except for wall color. The four colors used
Were light green, light blue, gray, and red. The psychologist wants to know whether room color
Has an effect on attitude, and, if so, wants to compare the mean attitudes of the trainees assigned to
The four room colors. At the end of the training program, the attitude of each trainee was measured
On a 60-pt. scale (the lower the score, the poorer the attitude). The data was subjected to a
One-way analysis of variance. 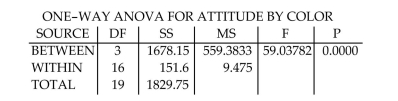
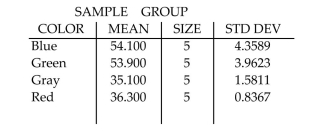 Give the null hypothesis for the ANOVA F-test shown on the printout.
(Multiple Choice)
4.8/5 (41)
Filters
- Essay(0)
- Multiple Choice(0)
- Short Answer(0)
- True False(0)
- Matching(0)