Exam 3: Statistics for Describing, Exploring, and Comparing Data
Exam 1: Introduction to Statistics85 Questions
Exam 2: Summarizing and Graphing Data82 Questions
Exam 3: Statistics for Describing, Exploring, and Comparing Data149 Questions
Exam 4: Probability170 Questions
Exam 5: Probability Distributions158 Questions
Exam 6: Normal Probability Distributions173 Questions
Exam 7: Estimates and Sample Sizes139 Questions
Exam 8: Hypothesis Testing130 Questions
Exam 9: Inferences From Two Samples105 Questions
Exam 10: Correlation and Regression129 Questions
Exam 11: Multinomial Experiments and Contingency Tables31 Questions
Exam 12: Analysis of Variance60 Questions
Exam 13: Nonparametric Statistics64 Questions
Exam 14: Statistical Process Control38 Questions
Select questions type
Provide an appropriate response.
-Describe how to find the percentile for a given score in a set of data. How does this process relate to the definition of a percentile score?
(Essay)
4.7/5  (31)
(31)
Find the median for the given sample data.
-The normal monthly precipitation (in inches)for August is listed for 20 different U.S. cities. Find the median of the data. 3.5 1.6 2.4 3.7 4.1
3.9 1.0 3.6 4.2 3.4
3.7 2.2 1.5 4.2 3.4
2.7 0.4 3.7 2.0 3.6
(Multiple Choice)
4.7/5 (35)
Find the variance for the given data. Round your answer to one more decimal place than the original data.
-The manager of an electrical supply store measured the diameters of the rolls of wire in the inventory. The diameters of the rolls (in m)are listed below. Compute the standard deviation s. 0.189 0.518 0.665 0.568 0.149 0.573 0.202
(Multiple Choice)
4.8/5 (32)
Provide an appropriate response.
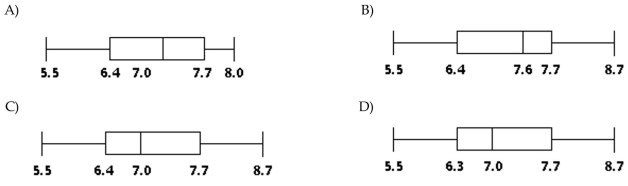
-The weights (in pounds)of 30 newborn babies are listed below. Construct a boxplot for the data set. 5.5 5.7 5.8 5.9 6.1 6.1 6.3 6.4 6.5 6.6 6.7 6.7 6.7 6.9 7.0 7.0 7.0 7.1 7.2 7.2 7.4 7.5 7.7 7.7 7.8 8.0 8.1 8.1 8.3 8.7
(Short Answer)
4.8/5 (34)
Provide an appropriate response.
-Describe any similarities or differences in the two distributions represented by the following boxplots. Assume the two boxplots have the same scale. 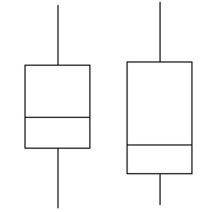
(Not Answered)
This question doesn't have any answer yet
Solve the problem.
-The maximum value of a distribution is 14.4 and the minimum value is 4.9. Use the range rule of thumb to find the standard deviation. Round results to the nearest tenth.
(Multiple Choice)
4.8/5 (40)
Find the midrange for the given sample data.
-3.8, 1.9, 8.8, 3.3, and 4.2
(Multiple Choice)
4.7/5 (31)
Provide an appropriate response.
-Explain how two data sets could have equal means and modes but still differ greatly. Give an example with two data sets to illustrate.
(Not Answered)
This question doesn't have any answer yet
Find the mode(s)for the given sample data.
-A meteorologist records the number of clear days in a given year in each of 21 different U.S. cities. The results are shown below. Find the midrange. 72 143 52 84 100 98 101 120 99 121 86 60 59 71 125 130 104 74 83 55 169
(Multiple Choice)
4.8/5 (32)
Solve the problem.
-A distribution of data has a maximum value of 81, a median value of 55.5, and a minimum of 30. Use the range rule of thumb to find the standard deviation. Round results to the nearest tenth.
(Multiple Choice)
4.8/5 (35)
Provide an appropriate response.
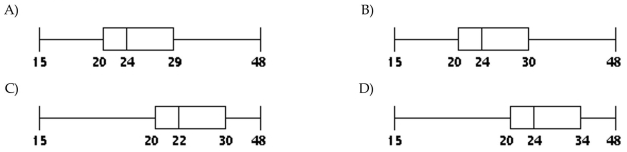
-The ages of the 35 members of a track and field team are listed below. Construct a boxplot for the data set. 15 16 18 18 18 19 20 20 20 21 21 22 22 23 23 24 24 24 25 25 26 27 27 28 29 29 30 31 31 33 34 35 39 42 48
(Short Answer)
4.8/5 (31)
Find the variance for the given data. Round your answer to one more decimal place than the original data.
-To get the best deal on a CD player, Tom called eight appliance stores and asked the cost of a specific model. The prices he was quoted are listed below:
Compute the standard deviation s.
(Multiple Choice)
5.0/5 (28)
Answer the question.
-The distances traveled (in miles)to 7 different swim meets are given below: Find the median distance traveled.
(Multiple Choice)
4.9/5 (39)
Find the midrange for the given sample data.
-15.0, 13.4, 14.0, 17.3, and 10.3
(Multiple Choice)
4.8/5 (36)
Solve the problem. Round results to the nearest hundredth.
-The mean of a set of data is 337.65 and its standard deviation is 96.01. Find the z score for a value of 422.02.
(Multiple Choice)
4.8/5 (38)
Provide an appropriate response.
-The two most frequently used measures of central tendency are the mean and the median. Compare these two measures for the following characteristics: Takes every score into account? Affected by extreme scores? Advantages.
(Not Answered)
This question doesn't have any answer yet
Provide an appropriate response.
-Boxplots are graphs that are useful for revealing central tendency, the spread of the data, the distribution of the data and the presence of outliers. Draw an example of a box plot and comment on each of these characteristics as shown by your boxplot.
(Essay)
4.9/5 (41)
Use the empirical rule to solve the problem.
-At one college, GPA's are normally distributed with a mean of 2.7 and a standard deviation of 0.5. What percentage of students at the college have a GPA between 2.2 and 3.2?
(Multiple Choice)
4.9/5 (36)
Solve the problem. Round results to the nearest hundredth.
-The mean height of a basketball team is 6.1 feet with a standard deviation of 0.2 feet. The team's center is 6.7 feet tall. Find the center's z score. Is his score unusual?
(Multiple Choice)
4.9/5 (30)
Find the mode(s)for the given sample data.
- 49 52 52 74 67 55
(Multiple Choice)
4.9/5 (29)
Filters
- Essay(0)
- Multiple Choice(0)
- Short Answer(0)
- True False(0)
- Matching(0)