Exam 3: Statistics for Describing, Exploring, and Comparing Data
Exam 1: Introduction to Statistics85 Questions
Exam 2: Summarizing and Graphing Data82 Questions
Exam 3: Statistics for Describing, Exploring, and Comparing Data149 Questions
Exam 4: Probability170 Questions
Exam 5: Probability Distributions158 Questions
Exam 6: Normal Probability Distributions173 Questions
Exam 7: Estimates and Sample Sizes139 Questions
Exam 8: Hypothesis Testing130 Questions
Exam 9: Inferences From Two Samples105 Questions
Exam 10: Correlation and Regression129 Questions
Exam 11: Multinomial Experiments and Contingency Tables31 Questions
Exam 12: Analysis of Variance60 Questions
Exam 13: Nonparametric Statistics64 Questions
Exam 14: Statistical Process Control38 Questions
Select questions type
For data which are heavily skewed to the right, P10 is likely to be closer to the median than P90.
(True/False)
4.9/5  (45)
(45)
Find the mode(s)for the given sample data.
-Bill kept track of the number of hours he spent exercising each week. The results for 15 weeks are shown below. Find the midrange.
7.2 7.0 7.2 7.4 7.5 7.5 6.5 8.0 8.1 7.4 8.7 7.0 7.5 8.9 7.5
(Multiple Choice)
4.7/5 (34)
Determine which score corresponds to the higher relative position.
-Data se data point 6
(Multiple Choice)
4.8/5 (27)
Find the range for the given data.
-Jeanne is currently taking college economics. The instructor often gives quizzes. On the past five quizzes, Jeanne got the following scores: 7 16 3 13 12
Compute the range.
(Multiple Choice)
4.8/5 (38)
Find the percentile for the data point.
-Use the given sample data to find
(Multiple Choice)
4.8/5 (20)
Find the range, variance, and standard deviation for each of the two samples, then compare the two sets of results.
-The manager of a bank recorded the amount of time each customer spent waiting in line during peak business hours one Monday. The frequency distribution below summarizes the results. Find the standard deviation. Round your answer to one decimal place. Waiting tim\& Number of (minutes customer 0-3 12 4-7 14 8-11 10 12-15 13 16-19 0 20-23 1
(Multiple Choice)
4.9/5 (26)
Find the mean for the given sample data.
-Bill kept track of the number of hours he spent exercising each week. The results for four months are shown below. Find the mean number of hours Bill spent exercising per week. Round your answer to two decimal places. 6.90 6.60 6.70 6.90 7.20 6.90 7.40 6.70 8.10 6.90 6.90 6.70 8.80 6.60 6.60 7.70 7.20 7.40
(Multiple Choice)
4.9/5 (33)
Use the empirical rule to solve the problem.
-The systolic blood pressure of 18-year-old women is normally distributed with a mean of 120 mmHg and a standard deviation of 12 mmHg. What percentage of 18-year-old women have a systolic blood pressure between 96 mmHg and 144 mmHg?
(Multiple Choice)
4.8/5 (38)
Provide an appropriate response.
-The mean of a data set is always/sometimes/never (select one)one of the data points in a set of data. Explain your answer with brief examples.
(Essay)
4.8/5 (30)
Provide an appropriate response.
-The highest temperatures ever recorded (in °F)in 32 different U.S. states are shown below. Construct a boxplot for the data set. 100 100 105 105 106 106 107 107 109 110 110 112 112 112 114 114 114 115 116 117 118 118 118 118 118 119 120 121 122 125 128 134
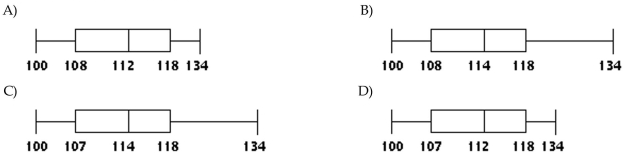
(Short Answer)
5.0/5 (32)
Find the variance for the given data. Round your answer to one more decimal place than the original data.
-The manager of a small dry cleaner employs six people. As part of their personnel file, she asked each one to record to the nearest one-tenth of a mile the distance they travel one way from home to work. The six distances are listed below:
Compute the standard deviation s.
(Multiple Choice)
4.7/5 (43)
If all the values in a data set are converted to z-scores, the shape of the distribution of the z-scores will be bell-shaped regardless of the distribution of the original data.
(True/False)
4.7/5 (30)
Solve the problem.
-For any data set of n values with standard deviation s, every value must be within of the mean. In a class of 15 students, the heights of the students have a mean of 66.8 inches and a standard deviation of 3.1 inches. The tallest student in class, a hopeful member of the basketball team, claims to be 77.5 inches tall. Could he be telling the truth?
(Multiple Choice)
4.9/5 (32)
Solve the problem.
-A company performs quality control on its juice bottles. It finds that the volumes of juice in its 16 ounce bottles have a mean of 16.2 ounces and a standard deviation of 0.07 ounces. Use the range rule of thumb to estimate the minimum and maximum "usual" volumes.
(Multiple Choice)
5.0/5 (32)
Find the variance for the given data. Round your answer to one more decimal place than the original data.
-196, 205, 215, 185, 229, 278, 165
(Multiple Choice)
4.8/5 (25)
Find the midrange for the given sample data.
-Compute the variance. A class of sixth grade students kept accurate records on the amount of time they spent playing video games during a one-week period. The times (in hours)are listed below:
19.8 21.6 13.4 26.7 25.6
19.2 17.0 12.9 26.8 15.2
(Multiple Choice)
4.8/5 (30)
Provide an appropriate response.
-In the Florida lottery, the numbers (between 1 and 49)are generated randomly with the expectation that each number has an equal chance of winning. Draw a boxplot which should illustrate the data set of all numbers picked for the lottery during the past year.
(Essay)
4.9/5 (39)
Provide an appropriate response.
-The test scores of 40 students are listed below. Construct a boxplot for the data set. 25 35 43 44 47 48 54 55 56 57 59 62 63 65 66 68 69 69 71 72 72 73 74 76 77 77 78 79 80 81 81 82 83 85 89 92 93 94 97 98
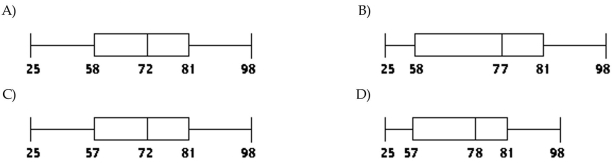
(Short Answer)
5.0/5 (38)
Provide an appropriate response.
-The weights (in ounces)of 27 tomatoes are shown below. Construct a boxplot for the data set. 2.0 2.1 2.2 2.2 2.4 2.4 2.5 2.5 2.5 2.6 2.6 2.7 2.7 2.7 2.7 2.8 2.8 2.8 2.9 2.9 3.0 3.0 3.0 3.1 3.1 3.2 3.4
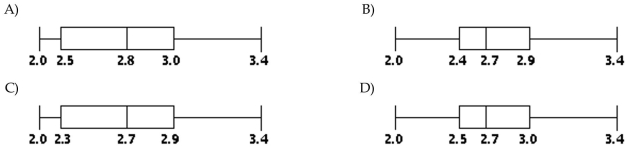
(Short Answer)
4.7/5 (42)
Find the variance for the given data. Round your answer to one more decimal place than the original data.
-15, 42, 53, 7, 9, 12, 14, 28, 47
(Multiple Choice)
4.8/5 (30)
Filters
- Essay(0)
- Multiple Choice(0)
- Short Answer(0)
- True False(0)
- Matching(0)