Exam 3: Statistics for Describing, Exploring, and Comparing Data
Exam 1: Introduction to Statistics85 Questions
Exam 2: Summarizing and Graphing Data82 Questions
Exam 3: Statistics for Describing, Exploring, and Comparing Data149 Questions
Exam 4: Probability170 Questions
Exam 5: Probability Distributions158 Questions
Exam 6: Normal Probability Distributions173 Questions
Exam 7: Estimates and Sample Sizes139 Questions
Exam 8: Hypothesis Testing130 Questions
Exam 9: Inferences From Two Samples105 Questions
Exam 10: Correlation and Regression129 Questions
Exam 11: Multinomial Experiments and Contingency Tables31 Questions
Exam 12: Analysis of Variance60 Questions
Exam 13: Nonparametric Statistics64 Questions
Exam 14: Statistical Process Control38 Questions
Select questions type
Provide an appropriate response.
-The normal monthly precipitation (in inches)for August is listed for 20 different U.S. cities. Construct a boxplot for the data set. 0.4 1.0 1.5 1.6 2.0
2.2 2.4 2.7 3.4 3.4
3.5 3.6 3.6 3.7 3.7
3.9 4.1 4.2 4.2 7.0
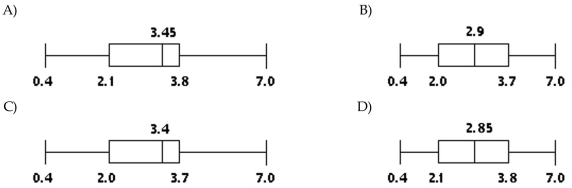
(Short Answer)
4.8/5  (26)
(26)
Provide an appropriate response.
-Marla scored 85% on her last unit exam in her statistics class. When Marla took the SAT exam, she scored at the 85 percentile in mathematics. Explain the difference in these two scores.
(Short Answer)
4.8/5 (27)
Solve the problem.
-The coefficient of variation, expressed as a percent, is used to describe the standard deviation relative to the mean. It allows us to compare variability of data sets with different measurement units and is calculated as follows:
Find the coefficient of variation for the following sample of weights (in pounds):
139 136 186 105 197 133 172 152 116 125
(Multiple Choice)
4.8/5 (35)
Solve the problem.
-The heights of the adults in one town have a mean of 67.5 inches and a standard deviation of 3.4 inches. What can you conclude from Chebyshev's theorem about the percentage of adults in the town whose heights are between 60.7 and 74.3 inches?
(Multiple Choice)
4.9/5 (36)
Solve the problem.
-The data below consists of the heights (in inches)of 20 randomly selected women. Find the 10% trimmed mean of the data set. The 10% trimmed mean is found by arranging the data in order, deleting the bottom 10% of the values and the top 10% of the values and then calculating the mean of the remaining values. 62 64 67 61 63 68 70 67 62 63 61 64 75 68 60 59 64 68 65 71
(Multiple Choice)
4.8/5 (39)
Find the mode(s)for the given sample data.
-The weights (in ounces)of 18 cookies are shown. Find the midrange. 0.63 1.28 0.87 0.99 0.81 1.43
1.28 1.20 0.63 1.45 1.37 1.08
1.37 1.45 0.81 1.37 0.99 0.87
(Multiple Choice)
4.8/5 (33)
Answer the question.
-The weights (in ounces)of 21 cookies are shown. Find the median weight. 0.67 1.42 0.83 1.62 0.75 0.82 1.03 1.42 1.53 0.93 0.67 1.21 1.04 0.83 0.47 1.21 0.82 1.04 1.72 0.75 0.56
(Multiple Choice)
4.8/5 (45)
Find the percentile for the data point.
-Data set:
data point 130
(Multiple Choice)
4.8/5 (39)
Find the standard deviation of the data summarized in the given frequency distribution.
-A department store, on average, has daily sales of $29,112.90. The standard deviation of sales is $1500. On Tuesday, the store sold $35,669.13 worth of goods. Find Tuesday's z score. Was Tuesday an unusually good day?
(Multiple Choice)
4.9/5 (41)
Find the percentile for the data point.
-The test scores of 32 students are listed below. Find Q3. 32 37 41 44 46 48 53 55 56 57 59 63 65 66 68 69 70 71 74 74 75 77 78 79 80 82 83 86 89 92 95 99
(Multiple Choice)
4.7/5 (28)
Find the midrange for the given sample data.
-The weights (in ounces)of 10 cookies are shown. 0.71 0.69 0.82 1.45 1.34 1.06 0.67 1.24 1.16 0.79 Compute the variance.
(Multiple Choice)
4.8/5 (39)
Find the mean of the data summarized in the given frequency distribution.
-The heights of a group of professional basketball players are summarized in the frequency distribution below. Find the mean height. Round your answer to one decimal place. Height (in.) Frequency 70-71 2 72-73 4 74-75 12 76-77 9 78-79 10 80-81 7 82-83 1
(Multiple Choice)
4.9/5 (33)
Find the range, variance, and standard deviation for each of the two samples, then compare the two sets of results.
-A company had 80 employees whose salaries are summarized in the frequency distribution below. Find the standard deviation. Salary Employees 5,001-10,000 11 10,001-15,000 15 15,001-20,000 19 20,001-25,000 10 25,001-30,000 25
(Multiple Choice)
4.9/5 (35)
Solve the problem.
-The ages of the members of a gym have a mean of 40 years and a standard deviation of 13. Use the range rule of thumb to estimate the minimum and maximum "usual" ages.
(Multiple Choice)
4.9/5 (39)
Solve the problem.
-The following is a set of data showing the water temperature in a heated tub at different time intervals. Use the range rule of thumb to find the standard deviation. Round results to the nearest tenth.
(Multiple Choice)
4.8/5 (39)
Find the z-score corresponding to the given value and use the z-score to determine whether the value is unusual.
Consider a score to be unusual if its z-score is less than -2.00 or greater than 2.00. Round the z-score to the nearest tenth
if necessary.
-Which is better, a score of 92 on a test with a mean of 71 and a standard deviation of 15, or a score of 688 on a test with a mean of 493 and a standard deviation of 150?
(Multiple Choice)
4.9/5 (29)
Find the midrange for the given sample data.
-9, 5, -4, 9, and -2
(Multiple Choice)
4.8/5 (40)
Find the mode(s)for the given sample data.
-The speeds (in mph)of the cars passing a certain checkpoint are measured by radar. The results are shown below. Find the midrange. 44.5 41.4 42.6 40.7 43.3
40.0 44.7 41.4 44.5 42.5
43.7 41.4 40.7 43.7 41.4
(Multiple Choice)
4.8/5 (31)
Find the mean for the given sample data.
-Six college buddies bought each other Christmas gifts. They spent: \ 122.34 \ 233.13 \ 222.32 \ 130.44 \ 165.25 \ 197.41 What was the mean amount spent? Round your answer to the nearest cent.
(Multiple Choice)
4.8/5 (29)
Find the mode(s)for the given sample data.
-The speeds (in mi/h)of the cars passing a certain checkpoint are measured by radar. The results are shown below. 42.8 41.8 40.1 43.5 43.7 43.7 41.8 44.3 42.3 43.5 42.8 44.3 43.5 44.9 41.8 41.8 41.8 40.1 44.0 42.8
(Multiple Choice)
5.0/5 (35)
Filters
- Essay(0)
- Multiple Choice(0)
- Short Answer(0)
- True False(0)
- Matching(0)