Exam 3: Statistics for Describing, Exploring, and Comparing Data
Exam 1: Introduction to Statistics85 Questions
Exam 2: Summarizing and Graphing Data82 Questions
Exam 3: Statistics for Describing, Exploring, and Comparing Data149 Questions
Exam 4: Probability170 Questions
Exam 5: Probability Distributions158 Questions
Exam 6: Normal Probability Distributions173 Questions
Exam 7: Estimates and Sample Sizes139 Questions
Exam 8: Hypothesis Testing130 Questions
Exam 9: Inferences From Two Samples105 Questions
Exam 10: Correlation and Regression129 Questions
Exam 11: Multinomial Experiments and Contingency Tables31 Questions
Exam 12: Analysis of Variance60 Questions
Exam 13: Nonparametric Statistics64 Questions
Exam 14: Statistical Process Control38 Questions
Select questions type
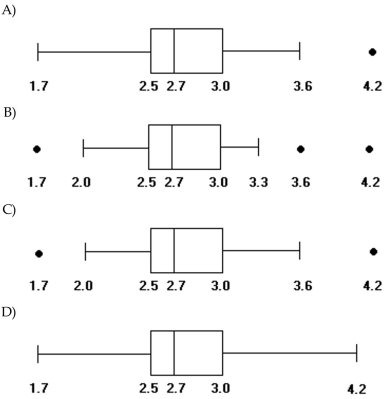
Construct a modified boxplot for the data.
-The weights (in ounces)of 27 tomatoes are listed below. Construct a modified boxplot for the data. 1.7 2.0 2.2 2.2 2.4 2.5 2.5 2.5 2.6 2.6 2.6 2.7 2.7 2.7 2.8 2.8 2.8 2.9 2.9 2.9 3.0 3.0 3.1 3.1 3.3 3.6 4.2
(Short Answer)
4.9/5  (30)
(30)
Determine which score corresponds to the higher relative position.
-Which score has the highest relative position: a score of 36 on a test for which and , a score of on a test for which and or a score of 468 on a test for which and ?
(Multiple Choice)
4.7/5 (32)
Find the median for the given sample data.
--20, -27, -46, -27, -49, -27, -49
(Multiple Choice)
4.9/5 (39)
Provide an appropriate response.
-Heights of adult women are known to have a bell-shaped distribution. Draw a boxplot to illustrate the results.
(Essay)
4.8/5 (32)
Solve the problem.
-When data are summarized in a frequency distribution, the median can be found by first identifying the median class (the class that contains the median). We then assume that the values in that class are evenly distributed and we can interpolate. This process can be described by where n is the sum of all class frequencies and m is the sum of the class frequencies that precede the median class. Use this procedure to find the median of the frequency distribution below: Score Frequency 50-59 21 60-69 24 70-79 22 80-89 16 90-99 17
(Multiple Choice)
4.8/5 (25)
Solve the problem.
-The signal-to-noise ratio of a set of data is obtained by dividing the mean by the standard deviation. Find the signal-to-noise ratio for the following sample of weights (in pounds): 144 125 186 105 197 136 172 155 116 125
(Multiple Choice)
4.8/5 (31)
Solve the problem.
-Construct a data set for which the range is misleading as a measure of variation. Explain why the range is misleading and suggest an alternative measure of variation.
(Essay)
4.8/5 (32)
If all the values in a data set are converted to z-scores, the shape of the distribution of the z-scores will be the same as the distribution of the original data.
(True/False)
4.9/5 (39)
Find the midrange for the given sample data.
-Compute the variance. Jeanne is currently taking college zoology. The instructor often gives quizzes. On the past five quizzes, Jeanne got the following scores: 11 11 10 10 13
(Multiple Choice)
4.9/5 (33)
Filters
- Essay(0)
- Multiple Choice(0)
- Short Answer(0)
- True False(0)
- Matching(0)