Exam 11: Inference on Two Samples
Exam 1: Data Collection118 Questions
Exam 2: Creating Tables and Drawing Pictures of Data77 Questions
Exam 3: Numerically Summarizing Data158 Questions
Exam 4: Describing the Relation Between Two Variables183 Questions
Exam 5: Probability266 Questions
Exam 6: Discrete Probability Distributions149 Questions
Exam 7: The Normal Probability Distribution123 Questions
Exam 8: Sampling Distributions46 Questions
Exam 9: Estimating the Value of a Parameter Using Confidence Intervals109 Questions
Exam 10: Hypothesis Tests Regarding a Parameter156 Questions
Exam 11: Inference on Two Samples125 Questions
Exam 12: Inference on Categorical Data39 Questions
Exam 13: Comparing Three or More Means51 Questions
Exam 14: Inference of the Least-Squares Regression Model and Multiple Regression82 Questions
Exam 15: Nonparametric Statistics74 Questions
Select questions type
Determine the Appropriate Hypothesis Test to Perform
-A random sample of individuals results in successes. An independent sample of individuals results in successes. Does this represent sufficient evidence to conclude that at the level of significance?
(Short Answer)
4.9/5  (39)
(39)
Construct and Interpret Confidence Intervals Regarding the Difference of Two Independent Means
-Construct a confidence interval for . Two samples are randomly selected from each population.
The sample statistics are given below.
=50 =60 =25 =23 =1.5 =1.9
(Multiple Choice)
4.8/5 (30)
Test Hypotheses Regarding Two Population Standard Deviations
-A study was conducted to determine if the variances of librarian salaries from two neighboring cities were equal. A sample of 25 librarians from each city was selected. The first city had a standard deviation of s , and the second city had a standard deviation . Test the hypothesis that the variances of the salaries from both cities are equal. Use Assume the samples were randomly selected from normal populations.
(Short Answer)
4.9/5 (41)
Test Hypotheses Regarding Two Population Standard Deviations
-A random sample of 21 women had cholesterol levels with a variance of . A random sample of 18 men had cholesterol levels with a variance of 737.28. Test the hypothesis that the cholesterol levels for women have a larger variance than those for men. Use . Assume the samples were randomly selected from normal populations.
(Short Answer)
4.9/5 (40)
Construct and Interpret Confidence Intervals Regarding the Difference of Two Independent Means
-Construct a confidence interval for . Two samples are randomly selected from each population.
The sample statistics are given below.
=40 =35 1=12 2=13 =2.5 =2.8
(Multiple Choice)
4.8/5 (36)
Test Hypotheses Regarding Matched-Pairs Data
-Data sets and are dependent. Find .
A 22 20 39 35 23 B 20 16 17 27 14
Assume that the paired data came from a population that is normally distributed.
(Multiple Choice)
4.8/5 (39)
Construct and Interpret Confidence Intervals for the Difference between Two Population Proportions
-True or False: When constructing a confidence interval for the difference of two population proportions, a pooled estimate of is not required.
(Multiple Choice)
4.9/5 (44)
Test Hypotheses Regarding Two Population Standard Deviations
-Test the hypothesis that at the level of significance for the given sample data.
Population 1 Population 2 16 13 20.4 23
(Multiple Choice)
4.8/5 (49)
Use McNemar s Test to Compare Two Proportions from Matched -pairs Data
-A researcher wants to determine whether there is a difference between two sunscreen lotions. Participants in a marathon race on a hot, sunny day applied lotion to one arm and lotion to the other arm. The results are shown in the table.
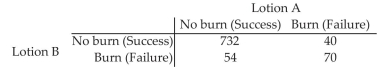 Is there a difference in the effectiveness of the two lotions in preventing sunburn? Use the critical-value method and the level of significance.
(Short Answer)
4.9/5 (36)
Test Hypotheses Regarding the Difference of Two Independent Means
-Find the standardized test statistic to test the hypothesis that . Two samples are randomly selected from each population. The sample statistics are given below. Use .
=50 =60 1=23 =21 =1.5 =1.9
(Multiple Choice)
4.9/5 (32)
Test Hypotheses Regarding Two Population Standard Deviations
-Test the hypothesis that at the level of significance for the given sample data.
Population 1 Population 2 25 17 5.76 2.21
(Multiple Choice)
4.9/5 (37)
Test Hypotheses Regarding Matched-Pairs Data
-Data sets A and B are dependent. Test the claim that . Use .
A 7.1 8.1 10.0 7.0 7.1 B 9.5 8.4 8.3 8.2 9.6
Assume that the paired data came from a population that is normally distributed.
(Short Answer)
4.7/5 (36)
Provide an appropriate response.
-A random sample of 100 students at a high school was asked whether they would ask their father or mother for help with a financial problem. A second sample of 100 different students was asked the same question regarding a dating problem. If 43 students in the first sample and 47 students in the second sample replied that they turned to their mother rather than their father for help, test the hypothesis of no difference in the proportions. Use .
(Short Answer)
4.8/5 (33)
Test Hypotheses Regarding the Difference of Two Independent Means
-Test the hypothesis that . Two samples are randomly selected from normal populations. The sample statistics are given below.
=18 =13 1=435 2=420 =40 =25
(Short Answer)
4.8/5 (38)
Determine the Appropriate Hypothesis Test to Perform
-A survey found that 44 of 78 people who don't drink coffee often have trouble sleeping and 49 of 87 coffee drinkers often have trouble sleeping. Construct a confidence interval to determine whether there is a difference between the proportion of noncoffee drinkers who have trouble sleeping and the proportion of coffee drinkers who have trouble sleeping.
(Short Answer)
4.9/5 (37)
Find Critical Values of the F-distribution
-Find the critical value for a right-tailed test using , degrees of freedom in the numerator , and degrees of freedom in the denominator .
(Multiple Choice)
5.0/5 (38)
Classify the two given samples as independent or dependent. Sample 1: The scores of 23 students who took a statistics final Sample 2: The scores of 23 different students who took a physics final
(Multiple Choice)
4.8/5 (39)
Construct and Interpret Confidence Intervals for the Difference between Two Population Proportions
-Construct a confidence interval for - p2 for a survey that finds of 240 males and of 200 females are opposed to the death penalty.
(Multiple Choice)
4.8/5 (39)
Provide an appropriate response.
-In the initial test of the Salk vaccine for polio, 400,000 children were selected and divided into two groups of 200,000 . One group was vaccinated with the Salk vaccine while the second group was vaccinated with a placebo. Of those vaccinated with the Salk vaccine, 33 later developed polio. Of those receiving the placebo, 115 later developed polio. Test the hypothesis that the Salk vaccine is effective in lowering the polio rate. Use .
(Short Answer)
4.8/5 (33)
Determine the Appropriate Hypothesis Test to Perform
-A random sample of size results in a sample mean of 24 and a sample standard deviation of . An independent sample of size results in a sample mean of 22 and a sample standard deviation of . Does this constitute sufficient evidence to conclude that the population means differ at the level of significance?
(Short Answer)
4.9/5 (38)
Filters
- Essay(0)
- Multiple Choice(0)
- Short Answer(0)
- True False(0)
- Matching(0)