Exam 11: Inference on Two Samples
Exam 1: Data Collection118 Questions
Exam 2: Creating Tables and Drawing Pictures of Data77 Questions
Exam 3: Numerically Summarizing Data158 Questions
Exam 4: Describing the Relation Between Two Variables183 Questions
Exam 5: Probability266 Questions
Exam 6: Discrete Probability Distributions149 Questions
Exam 7: The Normal Probability Distribution123 Questions
Exam 8: Sampling Distributions46 Questions
Exam 9: Estimating the Value of a Parameter Using Confidence Intervals109 Questions
Exam 10: Hypothesis Tests Regarding a Parameter156 Questions
Exam 11: Inference on Two Samples125 Questions
Exam 12: Inference on Categorical Data39 Questions
Exam 13: Comparing Three or More Means51 Questions
Exam 14: Inference of the Least-Squares Regression Model and Multiple Regression82 Questions
Exam 15: Nonparametric Statistics74 Questions
Select questions type
Construct and Interpret Confidence Intervals for the Difference between Two Population Proportions
-Construct a confidence interval for . The sample statistics listed below are from independent samples.
Sample statistics: , and
(Multiple Choice)
4.8/5  (40)
(40)
Test Hypotheses Regarding the Difference of Two Independent Means
-and come from populations that are normal. The sample statistics are given below.
=25 =30 1=19 =17 =1.5 =1.9
(Multiple Choice)
4.9/5 (30)
Provide an appropriate response.
-To test the effectiveness of a new drug designed to relieve flu symptoms, 200 patients were randomly selected and divided into two equal groups. One group of 100 patients was given a pill containing the drug while the other group of 100 was given a placebo. What can we conclude about the effectiveness of the drug if 62 of those actually taking the drug felt a beneficial effect while 41 of the patients taking the placebo felt a beneficial effect? Use .
(Short Answer)
4.8/5 (39)
Construct and Interpret Confidence Intervals about the Population Mean Difference of Matched -Pairs Data
-Construct a confidence interval for data sets and . Data sets and are dependent.
A 5.8 6.8 8.7 5.7 5.8 B 8.2 7.1 7.0 6.9 8.3
Assume that the paired data came from a population that is normally distributed.
(Multiple Choice)
4.9/5 (30)
Test Hypotheses Regarding the Difference of Two Independent Means
-Test the hypothesis that . Two samples are randomly selected from normal populations. The sample statistics are given below.
1=11 =18 1=1.7 =2.1 =0.76 =0.51
(Short Answer)
4.8/5 (45)
Construct and Interpret Confidence Intervals Regarding the Difference of Two Independent Means
-Construct a confidence interval for . Two samples are randomly selected from normal populations.
The sample statistics are given below.
=8 =7 1=4.1 =5.5 =0.76 =2.51
(Multiple Choice)
4.9/5 (43)
Find Critical Values of the F-distribution
-Find the critical value for a left-tailed test using , degrees of freedom in the numerator , and degrees of freedom in the denominator .
(Multiple Choice)
4.8/5 (31)
Test Hypotheses Regarding the Difference of Two Independent Means
-Find the standardized test statistic, t, to test the hypothesis that . Two samples are randomly selected and come from populations that are normal. The sample statistics are given below.
=18 =13 1=680 =665 =40 =25
(Multiple Choice)
4.9/5 (29)
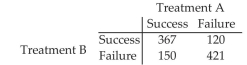
Use McNemar s Test to Compare Two Proportions from Matched -pairs Data
-Test whether the population proportions differ at the level of significance by determining the null and alternative hypotheses, the test statistic, and the P-value. Assume that the samples are dependent and that they were obtained randomly.
(Short Answer)
4.9/5 (41)
Determine the Appropriate Hypothesis Test to Perform
-The data represent the measure of a variable before and after a treatment. Does the sample evidence suggest that the treatment is effective in increasing the value of the response variable? Use the level of significance. Assume that the differenced data come from a population that is normally distributed with no outliers.
Subject A B C D E F G Before, 9.4 9.7 9.4 9.5 9.7 9.5 9.7 After, 9.5 9.9 9.4 9.4 9.8 9.8 9.5
(Short Answer)
4.7/5 (42)
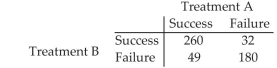
Determine the Appropriate Hypothesis Test to Perform
-Conduct the appropriate test to determine if the population proportions for the two treatments differ at the level of significance. Assume that the samples are dependent and obtained randomly.
(Short Answer)
4.8/5 (31)
Test Hypotheses Regarding the Difference of Two Independent Means
-Find the standardized test statistic, , to test the hypothesis that . Two samples are randomly selected and come from populations that are normal. The sample statistics are given below.
=14 =12 1=10 2=11 =2.5 =2.8
(Multiple Choice)
4.8/5 (29)
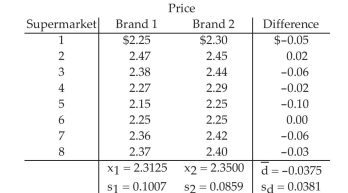
Construct and Interpret Confidence Intervals about the Population Mean Difference of Matched -Pairs Data
-We are interested in comparing the average supermarket prices of two leading colas in the Tampa area. Our sample was taken by randomly going to each of eight supermarkets and recording the price of a six - pack of cola of each brand. The data are shown in the following table. Find a confidence interval for the difference in mean price of brand 1 and brand 2. Assume that the paired data came from a population that is normally distributed.
(Multiple Choice)
4.8/5 (45)
Provide an appropriate response.
-Find the standardized test statistic, , to test the hypothesis that . Use . The sample statistics listed below are from independent samples.
Sample statistics: , and
(Multiple Choice)
4.8/5 (42)
Provide an appropriate response.
-Test the hypothesis that . Use . The sample statistics listed below are from independent samples.
Sample statistics: , and
(Short Answer)
4.7/5 (36)
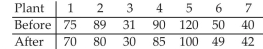
Construct and Interpret Confidence Intervals about the Population Mean Difference of Matched -Pairs Data
-Seven randomly selected plants that bottle the same beverage implemented a time management program in hopes of improving productivity. The average time, in minutes, that it took the companies to produce the same quantity of bottles before and after the program are listed below. Assume the two population distributions are normal. Construct a confidence interval for . Assume that the paired data came from a population that is normally distributed.
(Multiple Choice)
4.8/5 (34)
Test Hypotheses Regarding the Difference of Two Independent Means
-Find the standardized test statistic to test the hypothesis that . Two samples are randomly selected from each population. The sample statistics are given below. Use .
=51 =38 1=8.6 2=9 1=0.76 =0.51
(Multiple Choice)
4.8/5 (43)
Provide an appropriate response.
-Test the hypothesis that . Use . The sample statistics listed below are from independent samples. Sample statistics; , and .
(Short Answer)
5.0/5 (42)
Construct and Interpret Confidence Intervals about the Population Mean Difference of Matched -Pairs Data
-Construct a confidence interval for data sets A and B. Data sets A and B are dependent.
A 30 28 47 43 31 B 28 24 25 35 22
Assume that the paired data came from a population that is normally distributed.
(Multiple Choice)
4.7/5 (39)
Provide an appropriate response.
-Test the hypothesis that . Use . The sample statistics listed below are from independent samples.
Sample statistics: , and
(Short Answer)
4.8/5 (41)
Filters
- Essay(0)
- Multiple Choice(0)
- Short Answer(0)
- True False(0)
- Matching(0)