Exam 11: Inference on Two Samples
Exam 1: Data Collection118 Questions
Exam 2: Creating Tables and Drawing Pictures of Data77 Questions
Exam 3: Numerically Summarizing Data158 Questions
Exam 4: Describing the Relation Between Two Variables183 Questions
Exam 5: Probability266 Questions
Exam 6: Discrete Probability Distributions149 Questions
Exam 7: The Normal Probability Distribution123 Questions
Exam 8: Sampling Distributions46 Questions
Exam 9: Estimating the Value of a Parameter Using Confidence Intervals109 Questions
Exam 10: Hypothesis Tests Regarding a Parameter156 Questions
Exam 11: Inference on Two Samples125 Questions
Exam 12: Inference on Categorical Data39 Questions
Exam 13: Comparing Three or More Means51 Questions
Exam 14: Inference of the Least-Squares Regression Model and Multiple Regression82 Questions
Exam 15: Nonparametric Statistics74 Questions
Select questions type
Find Critical Values of the F-distribution
-Find the right-hand critical value for a two-tailed test using , degrees of freedom in the numerator , and degrees of freedom in the denominator .
(Multiple Choice)
4.9/5  (44)
(44)
Test Hypotheses Regarding the Difference of Two Independent Means
-Test the hypothesis that . Two samples are randomly selected from each population. The sample statistics are given below. Use .
=100 =125 1=765 2=750 =45 =25
(Short Answer)
4.7/5 (39)
Test Hypotheses Regarding Matched-Pairs Data
-A football coach claims that players can increase their strength by taking a certain supplement. To test the theory, the coach randomly selects 9 athletes and gives them a strength test using a bench press. The results are listed below. Thirty days later, after regular training using the supplement, they are tested again. The new results are listed below. Test the claim that the supplement is effective in increasing the athletes' strength. Use . Assume that the distribution is normally distributed.
Athlete 1 2 3 4 5 6 7 8 9 Before 215 240 188 212 275 260 225 200 185 After 225 245 188 210 282 275 230 195 190
(Short Answer)
4.9/5 (40)
Classify the two given samples as independent or dependent.
Sample 1: Pre-training blood pressure of 27 people
Sample 2: Post-training blood pressure of 27 people
(Multiple Choice)
4.9/5 (32)
Provide an appropriate response.
-A recent survey showed that in a sample of 100 elementary school teachers, 15 were single. In a sample of 180 high school teachers, 36 were single. Is the proportion of high school teachers who were single greater than the proportion of elementary teachers who were single? Use .
(Short Answer)
4.9/5 (35)
Classify the two given samples as independent or dependent. Sample 1: The heights in inches of 19 newborn females Sample 2: The heights in inches of 19 newborn males
(Multiple Choice)
4.9/5 (35)
Find Critical Values of the F-distribution
-Find the left-tailed and right-tailed critical F-values for a two-tailed test. Let , degrees of freedom in the numerator , and degrees of freedom in the denominator .
(Short Answer)
4.9/5 (35)
Test Hypotheses Regarding Two Population Standard Deviations
-A local supermarket claims that the variance of waiting time for its customers to be served is the lowest in the area. A competitor supermarket checks the waiting time at both supermarkets. The sample statistics are listed below. Test the local bank's hypothesis. Use .
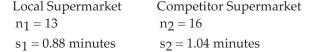 Assume the samples were randomly selected from normal populations.
(Short Answer)
4.7/5 (37)
Test Hypotheses Regarding the Difference of Two Independent Means
-A local supermarket claims that the waiting time for its customers to be served is the lowest in the area. A competitor's supermarket checks the waiting times at both supermarkets. The sample statistics are listed below. Test the local supermarket's hypothesis. Use .
Local Supermarket Competitor Supermarket
=15 =16 1=5.3 minutes 2=5.6 minutes =1.1 minutes =1.0 minutes
(Short Answer)
4.8/5 (32)
Provide an appropriate response.
-Find the standardized test statistic, , to test the hypothesis that . Use . The sample statistics listed below are from independent samples.
Sample statistics: , and
(Multiple Choice)
4.7/5 (33)
Test Hypotheses Regarding the Difference of Two Independent Means
-Test the hypothesis that . Two samples are randomly selected from normal populations. The sample statistics are given below.
=25 =30 1=23 =21 =1.5 =1.9
(Short Answer)
4.8/5 (41)
Determine the Appropriate Hypothesis Test to Perform
-A random sample of individuals results in successes. An independent sample of individuals results in successes. Does this represent sufficient evidence to conclude that at the level of significance?
(Short Answer)
4.8/5 (40)
Test Hypotheses Regarding the Difference of Two Independent Means
-The degrees of freedom used when testing two independent samples where the population standard deviation is unknown is
(Multiple Choice)
4.8/5 (37)
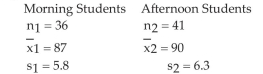
Test Hypotheses Regarding the Difference of Two Independent Means
-A history teacher believes that students in an afternoon class score higher than the students in a morning class. The results of a special exam are shown below. Can the teacher conclude that the afternoon students have a higher score? Use .
(Short Answer)
4.8/5 (31)
Construct and Interpret Confidence Intervals Regarding the Difference of Two Independent Means
-Construct a confidence interval for . Two samples are randomly selected from normal populations.
The sample statistics are given below.
=11 =18 1=4.8 =5.2 =0.76 =0.51
(Multiple Choice)
4.7/5 (33)
Test Hypotheses Regarding Matched-Pairs Data
-Data sets and are dependent. Test the claim that . Use .
A 37 35 54 50 38 B 35 31 32 42 29
Assume that the paired data came from a population that is normally distributed.
(Short Answer)
5.0/5 (30)
Test Hypotheses Regarding the Difference of Two Independent Means
-What is the for testing differences of the means of two independent samples?
(Multiple Choice)
4.9/5 (34)
Test Hypotheses Regarding the Difference of Two Independent Means
-A study was conducted to determine if the salaries of librarians from two neighboring cities were equal. A sample of 15 librarians from each city was randomly selected. The mean from the first city was $28,900 with a standard deviation of $2300. The mean from the second city was $30,300 with a standard deviation of $2100. Test the hypothesis that the salaries from both cities are equal.
(Essay)
4.9/5 (39)
Test Hypotheses Regarding the Difference of Two Independent Means
-At a local store, 65 female employees were randomly selected and it was found that their mean monthly income was $617 with a standard deviation of $121.50. Seventy-five male employees were also randomly selected and their mean monthly income was found to be $659 with a standard deviation of $168.70. Test the hypothesis that male employees have a higher monthly income than female employees. Use = 0.01.
(Short Answer)
4.8/5 (26)
Test Hypotheses Regarding the Difference of Two Independent Means
-Find the standardized test statistic to test the hypothesis that . Two samples are randomly selected from each population. The sample statistics are given below. Use .
=35 =42 1=20.04 2=22.59 =2.9 =2.8
(Multiple Choice)
4.9/5 (41)
Filters
- Essay(0)
- Multiple Choice(0)
- Short Answer(0)
- True False(0)
- Matching(0)