Exam 11: Inference on Two Samples
Exam 1: Data Collection118 Questions
Exam 2: Creating Tables and Drawing Pictures of Data77 Questions
Exam 3: Numerically Summarizing Data158 Questions
Exam 4: Describing the Relation Between Two Variables183 Questions
Exam 5: Probability266 Questions
Exam 6: Discrete Probability Distributions149 Questions
Exam 7: The Normal Probability Distribution123 Questions
Exam 8: Sampling Distributions46 Questions
Exam 9: Estimating the Value of a Parameter Using Confidence Intervals109 Questions
Exam 10: Hypothesis Tests Regarding a Parameter156 Questions
Exam 11: Inference on Two Samples125 Questions
Exam 12: Inference on Categorical Data39 Questions
Exam 13: Comparing Three or More Means51 Questions
Exam 14: Inference of the Least-Squares Regression Model and Multiple Regression82 Questions
Exam 15: Nonparametric Statistics74 Questions
Select questions type
Construct and Interpret Confidence Intervals for the Difference between Two Population Proportions
-In a recent survey of drinking laws, a random sample of 1000 women showed that were in favor of increasing the legal drinking age. In a random sample of 1000 men, favored increasing the legal drinking age. Construct a confidence interval for - .
(Multiple Choice)
4.8/5  (34)
(34)
Construct and Interpret Confidence Intervals Regarding the Difference of Two Independent Means
-A researcher wishes to determine whether people with high blood pressure can lower their blood pressure by performing yoga exercises. A treatment group and a control group are selected. The sample statistics are given below. Construct a confidence interval for the difference between the two population means, .
Would you recommend using yoga exercises? Explain your reasoning.
Treatment Group Control Group
1=100 =100 1=178 2=193 =35 =37
(Short Answer)
4.8/5 (39)
Test Hypotheses Regarding Matched-Pairs Data
-Data sets and are dependent. Find .
6.4 7.4 9.3 6.3 6.4 8.8 7.7 7.6 7.5 8.9
Assume that the paired data came from a population that is normally distributed.
(Multiple Choice)
4.8/5 (38)
Test Hypotheses Regarding Two Population Standard Deviations
-The time spent watching television (per day) of 121 women between the ages of 55 and 64 had a standard deviation of 63 minutes. The time spent watching television (per day) of a random sample of 121 women between the ages of 25 and 34 had a standard deviation of 84 minutes. Test the hypothesis that the older women are from a population with a variance less than that for women in the 25 to 34 age group. Use . Assume the samples were randomly selected from normal populations.
(Short Answer)
4.9/5 (42)
Test Hypotheses Regarding the Difference of Two Independent Means
-Find the standardized test statistic to test the hypothesis that . Two samples are randomly selected from each population. The sample statistics are given below. Use .
=40 =35 1=17 =18 1=2.5 =2.8
(Multiple Choice)
4.9/5 (36)
Test Hypotheses Regarding Matched-Pairs Data
-Nine students took the SAT. Their scores are listed below. Later on, they read a book on test preparation and retook the SAT. Their new scores are listed below. Test the claim that the book had no effect on their scores. Use . Assume that the distribution is normally distributed.
Student 1 2 3 4 5 6 7 8 9 Scores before reading book 720 860 850 880 860 710 850 1200 950 Scores after reading book 740 860 840 920 890 720 840 1240 970
(Short Answer)
4.7/5 (34)
Test Hypotheses Regarding Matched-Pairs Data
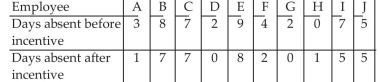
-A local company is concerned about the number of days missed by its employees due to illness. A random sample of 10 employees is selected. The number of days absent in one year is listed below. An incentive program is offered in an attempt to decrease the number of days absent. The number of days absent in one year after the incentive program is listed below. Test the claim that the incentive program cuts down on the number of days missed by employees. Use . Assume that the distribution is normally distributed.
(Short Answer)
4.8/5 (35)
Test Hypotheses Regarding the Difference of Two Independent Means
-Test the hypothesis that . Two samples are randomly selected from normal populations. The sample statistics are given below.
=14 =12 1=21 2=22 =2.5 =2.8
(Short Answer)
4.8/5 (42)
Find Critical Values of the F-distribution
-Find the left-hand critical value for a two-tailed test using , degrees of freedom in the numerator 5 , and degrees of freedom in the denominator .
(Multiple Choice)
4.9/5 (40)
Test Hypotheses Regarding the Difference of Two Independent Means
-Test the hypothesis that . Two samples are randomly selected from each population. The sample statistics are given below. Use .
=51 =38 1=8 2=8.4 1=0.76 =0.51
(Short Answer)
4.8/5 (34)
Use McNemar s Test to Compare Two Proportions from Matched -pairs Data
-A controversial bill is being debated in the state legislature. Representative Williams wants to estimate within 3 percentage points and with confidence the difference in the proportion of her male and female constituents who favor the bill. What sample size should she obtain?
(Multiple Choice)
4.8/5 (38)
Provide an appropriate response.
-Find the standardized test statistic estimate, , to test the hypothesis that p . Use . The sample statistics listed below are from independent samples.
Sample statistics: , and
(Multiple Choice)
4.8/5 (36)
Determine the Appropriate Hypothesis Test to Perform
-If , and , test whether the population standard deviations differ at the level of significance. Assume the populations are normally distributed.
(Short Answer)
4.8/5 (39)
Determine the Appropriate Hypothesis Test to Perform
-If , and ; test whether at the level of significance. Assume the populations are normally distributed.
(Short Answer)
4.8/5 (43)
Provide an appropriate response.
-A well-known study of 22,000 male physicians was conducted to determine if taking aspirin daily reduces the chances of a heart attack. Half of the physicians were given a regular dose of aspirin while the other half was given placebos. Six years later, among those who took aspirin, 104 suffered heart attacks while among those who took placebos, 189 suffered heart attacks. Does it appear that the aspirin can reduce the number of heart attacks among the sample group that took aspirin? Use .
(Short Answer)
4.7/5 (32)
Provide an appropriate response.
-To perform a hypothesis test of two population proportions, the pooled estimate or must be determined. The polled estimate, , is
(Multiple Choice)
4.7/5 (33)
Construct and Interpret Confidence Intervals about the Population Mean Difference of Matched -Pairs Data
-When forming a confidence interval for matched-pair data the point estimate is the
(Multiple Choice)
4.9/5 (41)
Test Hypotheses Regarding Two Population Standard Deviations
-Test the hypothesis that at the level of significance for the given sample data.
Population 1 Population 2 61 31 27.5 26.3
(Multiple Choice)
4.9/5 (40)
Construct and Interpret Confidence Intervals Regarding the Difference of Two Independent Means
-Construct a confidence interval for . Two samples are randomly selected from normal populations.
The sample statistics are given below.
=10 =12 1=25 2=23 =1.5 =1.9
(Multiple Choice)
4.9/5 (35)
Test Hypotheses Regarding the Difference of Two Independent Means
-A local restaurant claims that the waiting time for its patrons to be served is the lowest in the area. A competitor restaurant checks the waiting times at both restaurants. The sample statistics are listed below. Test the local restaurant's hypothesis. Use .
Local Restaurant Competitor Restaurant =45 =50 1=5.7 minutes 2=6 minutes =1.1 minutes 2=1.0 minute
(Short Answer)
5.0/5 (38)
Filters
- Essay(0)
- Multiple Choice(0)
- Short Answer(0)
- True False(0)
- Matching(0)