Exam 3: Describing, Exploring, and Comparing Data
Exam 1: Introduction to Statistics155 Questions
Exam 2: Exploring Data With Tables and Graphs132 Questions
Exam 3: Describing, Exploring, and Comparing Data225 Questions
Exam 4: Probability219 Questions
Exam 5: Discrete Probability Distributions205 Questions
Exam 6: Normal Probability Distributions254 Questions
Exam 7: Estimating Parameters and Determining Sample Sizes170 Questions
Exam 8: Hypothesis Testing187 Questions
Exam 9: Inferences From Two Samples192 Questions
Exam 10: Correlation and Regression174 Questions
Exam 11: Goodness-Of-Fit and Contingency Tables100 Questions
Exam 12: Analysis of Variance113 Questions
Exam 13: Nonparametric Tests121 Questions
Exam 14: Statistical Process Control90 Questions
Select questions type
Solve the problem.
-Skewness can be measured by Pearson's index of skewness:
If or , the data can be considered significantly skewed. Would you expect that incomes of all adults in the US would be skewed? In which direction? Why? Would you expect that for these incomes, Pearson's index of skewness would be greater than 1 , smaller than , or between and 1 ?
(Essay)
4.9/5  (35)
(35)
Find the median for the given sample data.
-Listed below are the amounts of time (in months) that the employees of a restaurant have been working at the restaurant. Find the median. 12 3 6 8.5 13 16 19 34 69 73 99 130 142 167
(Multiple Choice)
4.8/5 (34)
Solve the problem.
-The heights of the adults in one town have a mean of 67.1 inches and a standard deviation of 3.5 inches. What can you conclude from Chebyshev's theorem about the percentage of adults in the town whose heights are
Between 60.1 and 74.1 inches?
(Multiple Choice)
4.7/5 (39)
An engineer is designing a machine to manufacture gloves and she obtains the following sample of hand
lengths (mm) of randomly selected adult males. A frequency distribution is created from the data. The
frequencies in order are 1, 8, 56, 237, 382, 228, 48, 4, 1. Does it appear that the sample is from a population with a
normal distribution? Explain.
(Essay)
4.9/5 (32)
Find the variance for the given data. Round your answer to one more decimal place than the original data.
-Jeanne is currently taking college zoology. The instructor often gives quizzes. On the past five quizzes, Jeanne got the following scores: 5 3 16 1 20
(Multiple Choice)
4.8/5 (28)
Solve the problem. Round results to the nearest hundredth.
-The mean of a set of data is 4.11 and its standard deviation is 3.03. Find the z score for a value of 10.86.
(Multiple Choice)
4.8/5 (39)
Construct a boxplot for the given data. Include values of the 5-number summary in all boxplots.
-The weekly salaries (in dollars) of 24 randomly selected employees of a company are shown below. Construct a boxplot for the data set. 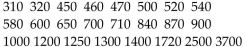
(Multiple Choice)
4.8/5 (39)
Find the standard deviation for the given sample data. Round your answer to one more decimal place than is present in
the original data.
-Christine is currently taking college astronomy. The instructor often gives quizzes. On the past seven quizzes, Christine got the following scores: 55 18 39 20 20 44 69
(Multiple Choice)
4.8/5 (36)
Listed below are the arrival delay times (in minutes) of randomly selected flights between New York's JFK
airport to Los Angeles (LAX). Negative values correspond to flights that arrive before their schedule time and
positive values represent delays. Calculate the range of the data and the standard deviation. Can the standard
deviation be negative? -15 -18 -32 -21 -9 -32 11 2
(Essay)
4.8/5 (39)
Solve the problem.
-In chemistry, the Kelvin scale is often used to measure temperatures. On the Kelvin scale, zero degrees is
absolute zero. Temperatures on the Kelvin scale are related to temperatures on the Celsius scale as follows:
K = C + 273°. Temperatures on the Fahrenheit scale are related to temperatures on the Celsius scale as follows:
F = 9C5 + 32°.
A set of temperatures is given in Celsius, Kelvin, and Fahrenheit. How will the standard deviations of the three
sets of data compare?
(Essay)
4.9/5 (36)
Find the indicated measure.
-The weights (in pounds) of 30 newborn babies are listed below. Find 5.5 5.7 5.8 6.0 6.1 6.1 6.3 6.4 6.5 6.6 6.7 6.7 6.7 6.9 7.0 7.0 7.0 7.1 7.2 7.2 7.4 7.5 7.7 7.7 7.8 8.0 8.1 8.1 8.3 8.7
(Multiple Choice)
4.7/5 (35)
Solve the problem. Round results to the nearest hundredth.
-The mean of a set of data is 108.06 and its standard deviation is 115.45. Find the z score for a value of 489.67.
(Multiple Choice)
4.9/5 (33)
If your score on your next statistics test is converted to a z score, which of these z scores would you prefer? Explain
your answer.
(Essay)
5.0/5 (44)
Jorge has his own business as a painter. The amounts he made in the last five months are shown below: \ 2426 \ 2463 \ 1451 \ 2154 \ 1119
Find the mean, median, and range of the data.
(Multiple Choice)
4.9/5 (36)
The weights (in pounds) of six dogs are listed below. Find the mean weight. 26 12 100 45 126 84
(Multiple Choice)
4.8/5 (41)
Provide an appropriate response.
-If all the values in a data set are converted to z-scores, the shape of the distribution of the z-scores will be bell-shaped regardless of the distribution of the original data. True or false?
(Multiple Choice)
4.8/5 (33)
Find the indicated measure.
-Use the given sample data to find .
49 52 52 52 74 67 55 55
(Multiple Choice)
4.8/5 (42)
Solve the problem.
-The harmonic mean is often used as a measure of center for data sets consisting of rates of change, such as speeds. It is found by dividing the number of values (n) by the sum of the reciprocals of all values, expressed as Pierre drives to work (a distance of 54 miles) at a speed of 74 mph and returns home at a speed of 53 mph. What
Is his average speed for the round trip? Use the harmonic mean.
(Multiple Choice)
4.9/5 (39)
The test scores of 40 students are listed below. Find P85. 30 35 43 44 47 48 54 55 56 57
59 62 63 65 66 68 69 69 71 72
72 73 74 76 77 77 78 79 80 81
81 82 83 85 89 92 93 94 97 98
(Multiple Choice)
4.8/5 (38)
Listed below are the amounts of time (in months) that the employees of a restaurant have been working at the restaurant. Find the mean. 1 5 6 8 11 14 17 46 61 90 99 126 143 167
(Multiple Choice)
4.8/5 (42)
Filters
- Essay(0)
- Multiple Choice(0)
- Short Answer(0)
- True False(0)
- Matching(0)