Exam 3: Describing, Exploring, and Comparing Data
Exam 1: Introduction to Statistics155 Questions
Exam 2: Exploring Data With Tables and Graphs132 Questions
Exam 3: Describing, Exploring, and Comparing Data225 Questions
Exam 4: Probability219 Questions
Exam 5: Discrete Probability Distributions205 Questions
Exam 6: Normal Probability Distributions254 Questions
Exam 7: Estimating Parameters and Determining Sample Sizes170 Questions
Exam 8: Hypothesis Testing187 Questions
Exam 9: Inferences From Two Samples192 Questions
Exam 10: Correlation and Regression174 Questions
Exam 11: Goodness-Of-Fit and Contingency Tables100 Questions
Exam 12: Analysis of Variance113 Questions
Exam 13: Nonparametric Tests121 Questions
Exam 14: Statistical Process Control90 Questions
Select questions type
Construct a boxplot for the given data. Include values of the 5-number summary in all boxplots.
-Describe any similarities or differences in the two distributions represented by the following boxplots. Assume
the two boxplots have the same scale. 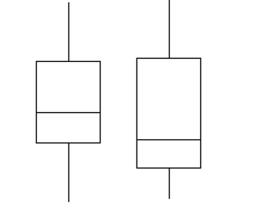
(Not Answered)
This question doesn't have any answer yet
Find the midrange for the given sample data.
-Listed below are the amounts of time (in months) that the employees of an electronics company have been working at the company. Find the midrange. 11 21 29 35 49 57 61 61 71 76 85 93 132 142
(Multiple Choice)
4.7/5  (36)
(36)
The race speeds (in minutes) for the top eight cars in a 200-mile race are listed below. Use the range rule of thumb to estimate the standard deviation. Round results to the nearest tenth. 181.0 180.6 189.2 182.2 175.6 180.0 177.9 181.8
(Multiple Choice)
4.7/5 (21)
Construct a boxplot for the given data. Include values of the 5-number summary in all boxplots.
-The weights (in ounces) of 27 tomatoes are listed below. 1.7 2.0 2.2 2.2 2.4 2.5 2.5 2.5 2.6 2.6 2.6 2.7 2.7 2.7 2.8 2.8 2.8 2.9 2.9 2.9 3.0 3.0 3.1 3.1 3.3 3.6 4.2
(Multiple Choice)
4.9/5 (47)
Find the standard deviation for the given sample data. Round your answer to one more decimal place than is present in
the original data.
-To get the best deal on a CD player, Tom called eight appliance stores and asked the cost of a specific model. The prices he was quoted are listed below: \ 356 \ 169 \ 293 \ 267 \ 386 \ 288 \ 318 \ 275
(Multiple Choice)
4.8/5 (39)
Find the coefficient of variation for each of the two sets of data, then compare the variation. Round results to one decimal
place.
-The customer service department of a phone company is experimenting with two different systems. On Monday they try the first system which is based on an automated menu system. On Tuesday they try the second
System in which each caller is immediately connected with a live agent. A quality control manager selects a
Sample of seven calls each day. He records the time for each customer to have his or her question answered. The
Times (in minutes) are listed below. Automated Menu: 11.7 7.4 3.9 2.9 9.2 6.3 5.5
Live agent: 6.2 2.9 4.4 4.1 3.4 5.2 3.7
(Multiple Choice)
4.9/5 (43)
Find the coefficient of variation for each of the two sets of data, then compare the variation. Round results to one decimal
place.
-Compare the variation in heights to the variation in weights of thirteen-year old girls. The heights (in inches) and weights (in pounds) of nine randomly selected thirteen-year old girls are listed below. Heights (inches): 58.7 61.4 62.1 64.7 60.1 58.3 64.6 63.7 66.1
(Multiple Choice)
4.9/5 (40)
Find the range, variance, and standard deviation for each of the two samples, then compare the two sets of results.
-When investigating times required for drive-through service, the following results (in seconds) were obtained. Restaurant A 120 123 153 128 124 118 154 110
Restaurant B 115 126 147 156 118 110 145 137
(Multiple Choice)
5.0/5 (36)
Approximately what percentage of apple diameters is greater than the 66th percentile?
(Multiple Choice)
4.8/5 (35)
Determine which score corresponds to the higher relative position.
-Which score has a higher relative position, a score of 271.2 on a test for which x = 240 and s = 24, or a score of 63.6 on a test for which x = 60 and s = 6?
(Multiple Choice)
4.9/5 (43)
Find the mode(s) for the given sample data.
- 20 42 46 42 49 42 49
(Multiple Choice)
4.8/5 (30)
The customer service department of a phone company is experimenting with two different systems. On Monday they try the first system which is based on an automated menu system. On Tuesday they try the second
System in which each caller is immediately connected with a live agent. A quality control manager selects a
Sample of seven calls each day. He records the time for each customer to have his or her question answered. The
Times (in minutes) are listed below. Find the coefficient of variation for each of the two sets of data, then compare the
Variation. Round results to one decimal place. Automated Menu: 11.7 7.4 3.9 2.9 9.2 6.3 5.5 Live agent: 6.2 2.9 4.4 4.1 3.4 5.2 3.7
(Multiple Choice)
4.8/5 (35)
Solve the problem.
-The data below consists of the heights (in inches) of 20 randomly selected women. Find the 10% trimmed mean of the data set. The 10% trimmed mean is found by arranging the data in order, deleting the bottom 10% of the
Values and the top 10% of the values and then calculating the mean of the remaining values. 67 68 64 61 65 64 70 67 62 63
61 64 75 67 60 59 64 68 65 71
(Multiple Choice)
4.9/5 (41)
Find the variance for the given data. Round your answer to one more decimal place than the original data.
-The weights (in ounces) of 10 cookies are shown. 1.4 0.99 1.37 0.58 0.68
0.57 1.1 0.96 1.2 1.27
(Multiple Choice)
4.8/5 (43)
Construct a boxplot for the given data. Include values of the 5-number summary in all boxplots.
-Describe any similarities or differences in the two distributions represented by the following boxplots. Assume
the two boxplots have the same scale. 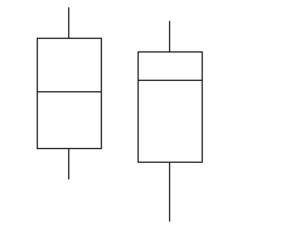
(Not Answered)
This question doesn't have any answer yet
Solve the problem.
-Rich Borne teaches Chemistry 101. Last week he gave his students a quiz. Their scores are listed below. 24 31 47 29 31 16 48 41 50 54 37 22
(Multiple Choice)
4.8/5 (33)
How will a high outlier in a data set affect the mean and median?
(Multiple Choice)
4.9/5 (36)
Provide an appropriate response.
-Human body temperatures have a mean of 98.20° F and a standard deviation of 0.62°. Sally's temperature can be described by z = -1.5. What is her temperature? Round your answer to the nearest hundredth.
(Multiple Choice)
4.9/5 (37)
Solve the problem.
-The signal-to-noise ratio of a set of data is obtained by dividing the mean by the standard deviation. Find the signal-to-noise ratio for the following sample of weights (in pounds): 128 147 186 105 197 155 172 130 116 125
(Multiple Choice)
4.9/5 (40)
Solve the problem.
-The 10% trimmed mean of a data set is found by arranging the data in order, deleting the bottom 10% of the
values and the top 10% of the values and then calculating the mean of the remaining values. What advantages
do you think that the trimmed mean has as compared to the mean?
(Essay)
4.9/5 (39)
Filters
- Essay(0)
- Multiple Choice(0)
- Short Answer(0)
- True False(0)
- Matching(0)