Exam 3: Describing, Exploring, and Comparing Data
Exam 1: Introduction to Statistics155 Questions
Exam 2: Exploring Data With Tables and Graphs132 Questions
Exam 3: Describing, Exploring, and Comparing Data225 Questions
Exam 4: Probability219 Questions
Exam 5: Discrete Probability Distributions205 Questions
Exam 6: Normal Probability Distributions254 Questions
Exam 7: Estimating Parameters and Determining Sample Sizes170 Questions
Exam 8: Hypothesis Testing187 Questions
Exam 9: Inferences From Two Samples192 Questions
Exam 10: Correlation and Regression174 Questions
Exam 11: Goodness-Of-Fit and Contingency Tables100 Questions
Exam 12: Analysis of Variance113 Questions
Exam 13: Nonparametric Tests121 Questions
Exam 14: Statistical Process Control90 Questions
Select questions type
Find the midrange for the given sample data.
- 49 52 52 52 74 67 55 55
(Multiple Choice)
4.8/5  (37)
(37)
Last year, nine employees of an electronics company retired. Their ages (in years) at retirement are listed below. Find the mode(s) for the given sample data. 51 61 62 57 50 67 68 58 53
(Multiple Choice)
4.8/5 (38)
Explain how two data sets could have equal means and modes but still differ greatly. Give an example with two
data sets to illustrate.
(Essay)
4.9/5 (33)
Solve the problem.
-For any data set of n values with standard deviation s, every value must be within s n - 1 of the mean. In a class of 20 students, the heights of the students have a mean of 67.4 inches and a standard deviation of 3.0
Inches. The tallest student in class, a hopeful member of the basketball team, claims to be
79)8 inches tall. Could he be telling the truth?
(Multiple Choice)
4.8/5 (42)
Describe any similarities or differences in the two distributions represented by the following boxplots. Assume the two
boxplots have the same scale. 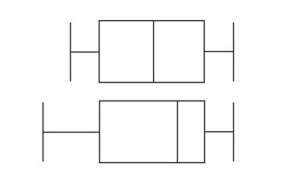
(Not Answered)
This question doesn't have any answer yet
Find the indicated measure.
-The test scores of 40 students are listed below. Find 30 35 43 44 47 48 54 55 56 57
59 62 63 65 66 68 69 69 71 72
72 73 74 76 77 77 78 79 80 81
81 82 83 85 89 92 93 94 97 98
(Multiple Choice)
4.8/5 (36)
A store manager kept track of the number of newspapers sold each week over a seven-week period. The results are shown below. 81 71 202 113 269 248 242 Find the median number of newspapers sold.
(Multiple Choice)
4.9/5 (38)
Find the midrange for the given sample data.
-A company had 80 employees whose salaries are summarized in the frequency distribution below. Find the mean salary.
(Multiple Choice)
4.8/5 (30)
Use the empirical rule to solve the problem.
-At one college, GPA's are normally distributed with a mean of 3 and a standard deviation of 0.6. What percentage of students at the college have a GPA between 2.4 and 3.6?
(Multiple Choice)
4.8/5 (28)
Solve the problem.
-Michael gets test grades of 75, 79, 82, and 87. He gets a 88 on her final exam. Find the weighted mean if the tests each count for 15% and the final exam counts for 40% of the final grade. Round to one decimal place.
(Multiple Choice)
4.9/5 (39)
Solve the problem.
-A student earned grades of C, A, B, and A. Those courses had these corresponding numbers of credit hours: 3, 6, 2, and 6. The grading system assigns quality points to letter grades as follows: A = 4, B = 3, C = 2, D = 1, and
F = 0. Compute the grade point average (GPA) and round the result to two decimal places.
(Multiple Choice)
4.9/5 (45)
Find the midrange for the given sample data.
-A comparison is made between summer electric bills of those who have central air and those who have window
units. May June July Aug Sept Central \ 32 \ 64 \ 80 \ 90 \ 65 Window \ 15 \ 84 \ 99 \ 120 \ 40
(Essay)
4.8/5 (36)
Which do you think has less variation: the IQ scores of students in your statistics class or the IQ scores of a
simple random sample taken from the general population? Why?
(Essay)
4.9/5 (32)
Find the median for the given sample data.
-The number of vehicles passing through a bank drive-up line during each 15-minute period was recorded. The results are shown below. Find the median number of vehicles going through the line in a fifteen-minute period. 25 27 25 28
28 25 30 27
35 31 31 29
24 31 25 20
15 27 27 27
(Multiple Choice)
4.9/5 (39)
Find the standard deviation for the given sample data. Round your answer to one more decimal place than is present in
the original data.
- 18 18 18 9 15 5 10 5 15
(Multiple Choice)
4.8/5 (41)
Construct a boxplot for the given data. Include values of the 5-number summary in all boxplots.
-The test scores of 32 students are listed below. Construct a boxplot for the data set. 57 57 59 63 65 66 68 69 70 71 74 74 75 77 78 79
70 71 74 74 75 77 78 79
81 82 83 86 89
(Multiple Choice)
5.0/5 (36)
The local Tupperware dealers earned these commissions last month: \ 2894.21 \ 1777.15 \ 2144.77 \ 4096.37 \ 4046.29 \ 1786.37 \ 3296.69 \ 4086.27 \ 2784.22 \ 4027.79 What was the mean commission earned? Round your answer to the nearest cent.
(Multiple Choice)
4.9/5 (39)
Find the midrange for the given sample data.
-The manager of a bank recorded the amount of time each customer spent waiting in line during peak business hours one Monday. The frequency distribution below summarizes the results. Find the mean waiting time.
Round your answer to one decimal place. Waiting time Number of (minutes) customers 0-3 10 4-7 13 8-11 12 12-15 5 16-19 7 20-23 1 24-27 2
(Multiple Choice)
4.9/5 (37)
Find the percentile for the data value.
- Data set: 3 13 10 6 3 3 13 6 3 13 2 13 15 4 9 3 12 10 6 13 data value: 6
(Multiple Choice)
4.7/5 (36)
The following are interval times (minutes) between eruptions of the Old Faithful geyser in Yellowstone
National Park (based on U.S. National Park Service data). 81 81 86 87 89 92 93 94 95 96 97 98 98 101 101 106 Identify the five number summary and construct a boxplot of these data.
(Essay)
4.8/5 (34)
Filters
- Essay(0)
- Multiple Choice(0)
- Short Answer(0)
- True False(0)
- Matching(0)