Exam 9: Estimation and Confidence Intervals
Exam 1: What Is Statistics79 Questions
Exam 2: Describing Data: Frequencydistributions and Graphic Presentation100 Questions
Exam 3: Describing Data: Numerical Measures214 Questions
Exam 4: Describing Data: Displaying and Exploring Pata138 Questions
Exam 5: A Sulvey of Probability Concepts121 Questions
Exam 6: Discrete Probability Distributions145 Questions
Exam 7: Continuous Probabilitydistributions79 Questions
Exam 8: Sampling Methods and the Central Umit Theorem134 Questions
Exam 9: Estimation and Confidence Intervals140 Questions
Exam 10: One-Sample Tests of Hypothesis111 Questions
Exam 11: Two Sample Tests of Hypothesis103 Questions
Exam 12: Analysis of Variance173 Questions
Exam 13: Linear Regression and Correlation132 Questions
Exam 14: Multiple Regression and Correlation Analysis126 Questions
Exam 15: Chi-Square Applications94 Questions
Exam 16: Decision Making and Payoff Tables in Investment Scenarios151 Questions
Select questions type
If α = 0.05 for a two-tailed test, how large is the acceptance area?
(Multiple Choice)
4.7/5  (29)
(29)
The mean length of a candy bar is 43 millimeters. There is concern that the settings of the machine
Cutting the bars have changed. Test the claim at the 0.02 level that there has been no change in the
Mean length. The alternate hypothesis is that there has been a change. Twelve bars (n = 12) were
Selected at random and their lengths recorded. The lengths are (in millimeters) 42, 39, 42, 45, 43,
40, 39, 41, 40, 42, 43, and 42. Has there been a statistically significant change in the mean length of
The bars? 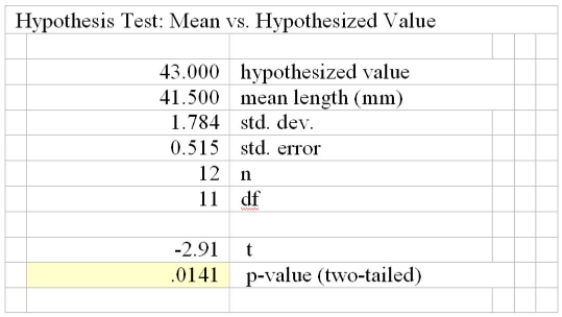
(Multiple Choice)
4.9/5 (35)
Based on the Nielsen ratings, the local CBS affiliate claims its 11 p.m. newscast reaches 41% of the
Viewing audience in the area. In a survey of 81 viewers, 36% indicated that they watch the late
Evening news on this local CBS station. What is the z test statistic?
(Multiple Choice)
4.9/5 (32)
Based on the Nielsen ratings, the local CBS affiliate claims its 11:00 PM newscast reaches 41% of the
Viewing audience in the area. In a survey of 100 viewers, 36% indicated that they watch the late
Evening news on this local CBS station.
What is the null hypothesis?
(Multiple Choice)
4.9/5 (29)
i. The level of significance is the risk we assume of rejecting the null hypothesis when it is actually
True.
ii. There is only one level of significance that is applied to all studies involving sampling.
iii. The researcher must decide on the level of significance before formulating a decision rule and
Collecting sample data.
(Multiple Choice)
4.8/5 (29)
What is the critical z-value for a one-tailed lower test at the 1% level of risk?
(Multiple Choice)
4.9/5 (36)
A restaurant that bills its house account monthly is concerned that the average monthly bill exceeds
$200 per account. A random sample of twelve accounts is selected, resulting in a sample mean of
$220 and a standard deviation of $12. The t-test is to be conducted at the 5% level of significance.
(Multiple Choice)
4.8/5 (31)
Given: null hypothesis is that the population mean is 16.9 against the alternative hypothesis that the
Population mean is not equal to 16.9. A random sample of 25 items results in a sample mean of 18.0
And the sample standard deviation is 2.4. It can be assumed that the population is normally
Distributed. Determine the observed "t" value.
(Multiple Choice)
5.0/5 (43)
i. The fifth and final step in testing a hypothesis is taking a sample and, based on the decision rule,
Deciding if the null hypothesis should be rejected.
ii. When the null hypothesis is not rejected, the conclusion is that our sample data does not allow us
To reject the null hypothesis.
iii. The level of significance is selected after setting up a decision rule and sampling the population.
(Multiple Choice)
4.7/5 (33)
The average cost of tuition, room and board at community colleges is reported to be $11,500 per
Year, but a financial administrator believes that the average cost is higher. A study conducted using
150 community colleges showed that the average cost per year is $12,000 with a standard
Deviation of $1,200. Let α = 0.05.
What are the null and alternative hypotheses for this study?
(Multiple Choice)
4.8/5 (37)
i. Two types of possible errors always exist when testing hypotheses-a Type I error, in which the
Null hypothesis is rejected when it should not have been rejected, and a Type II error in which the
Null hypothesis is not rejected when it should have been rejected.
ii. A test statistic is a value determined from sample information collected to test the null hypothesis.
iii. The region or area of rejection defines the location of all those values that are so large or so
Small that the probability of their occurrence under a true null hypothesis is rather remote.
(Multiple Choice)
4.8/5 (36)
A manufacturer claims that less than 1% of all his products do not meet the minimum government
Standards. A survey of 500 products revealed ten did not meet the standard. If the z-statistic is
-2)58 and the level of significance is 0.02, what is your decision?
(Multiple Choice)
4.8/5 (28)
A manufacturer claims that less than 1% of all his products do not meet the minimum government
Standards. A survey of 500 products revealed ten did not meet the standard.
If the z-statistic is -2.054 and the level of significance is 0.03, what is your decision?
(Multiple Choice)
4.8/5 (38)
A restaurant that bills its house account monthly is concerned that the average monthly bill exceeds
$200 per account. A random sample of twelve accounts is selected, resulting in a sample mean of
$220 and a standard deviation of $12. The t-test is to be conducted at the 5% level of significance.
Given the following printout, what can you determine? 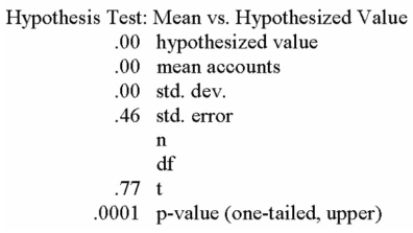
(Multiple Choice)
4.9/5 (39)
A manufacturer wants to increase the shelf life of a line of cake mixes. Past records indicate that the
Average shelf life of the mix is 216 days. After a revised mix has been developed, a sample of nine
Boxes of cake mix gave these shelf lives (in days): 215, 217, 218, 219, 216, 217, 217, 218 and 218. At the
0)025 level, has the shelf life of the cake mix increased?
(Multiple Choice)
4.8/5 (34)
Given: null hypothesis is that the population mean is 16.9 against the alternative hypothesis that the
Population mean is not equal to 16.9. A random sample of 16 items results in a sample mean of 17.8
And the sample standard deviation is 2.4. It can be assumed that the population is normally
Distributed. Determine the observed "t" value.
(Multiple Choice)
4.8/5 (39)
What must both np and n(1 - p) exceed in testing a hypothesis involving one proportion?
(Multiple Choice)
4.8/5 (33)
The mean length of a candy bar is 43 millimeters. There is concern that the settings of the machine
Cutting the bars have changed. Test the claim at the 0.02 level that there has been no change in the
Mean length. The alternate hypothesis is that there has been a change. Twelve bars (n = 12) were
Selected at random and their lengths recorded. The lengths are (in millimeters) 42, 39, 42, 45, 43,
40, 39, 41, 40, 42, 43, and 42. The mean of the sample is 41.5 and the standard deviation is 1.784.
Computed t = -2.913. Has there been a statistically significant change in the mean length of the
Bars?
(Multiple Choice)
4.7/5 (24)
i. Two examples of a hypothesis are: 1) mean monthly income from all sources for senior citizens is
$841 and 2) twenty percent of juvenile offenders ultimately are caught and sentenced to prison.
ii. Hypothesis testing is a procedure based on sample evidence and probability theory to decide
Whether the hypothesis is a reasonable statement.
iii. We call a statement about the value of a population parameter a hypothesis.
(Multiple Choice)
4.7/5 (36)
The Jamestown Steel Company manufactures and assembles desks and other office equipment at
Several plants. The weekly production of the Model A325 desk follows a normal probability
Distribution, with a mean of 200 and a standard deviation of 16. Recently, due to market expansion,
New production methods have been introduced and new employees hired. The vice president of
Manufacturing would like to investigate whether there has been an increase in the weekly
Production of the Model A325 desk. The mean number of desks produced last year (50 weeks,
Because the plant was shut down two weeks for vacation) is 203.5. Is the mean number of desks
Increased from 200? Test using the .10 significance level. 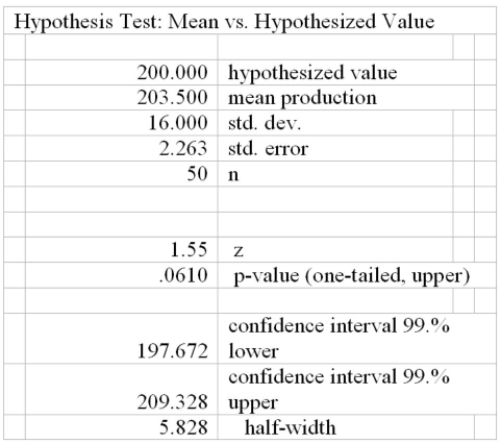
(Multiple Choice)
4.9/5 (26)
Filters
- Essay(0)
- Multiple Choice(0)
- Short Answer(0)
- True False(0)
- Matching(0)