Exam 14: Multiple Regression and Correlation Analysis
Exam 1: What Is Statistics79 Questions
Exam 2: Describing Data: Frequencydistributions and Graphic Presentation100 Questions
Exam 3: Describing Data: Numerical Measures214 Questions
Exam 4: Describing Data: Displaying and Exploring Pata138 Questions
Exam 5: A Sulvey of Probability Concepts121 Questions
Exam 6: Discrete Probability Distributions145 Questions
Exam 7: Continuous Probabilitydistributions79 Questions
Exam 8: Sampling Methods and the Central Umit Theorem134 Questions
Exam 9: Estimation and Confidence Intervals140 Questions
Exam 10: One-Sample Tests of Hypothesis111 Questions
Exam 11: Two Sample Tests of Hypothesis103 Questions
Exam 12: Analysis of Variance173 Questions
Exam 13: Linear Regression and Correlation132 Questions
Exam 14: Multiple Regression and Correlation Analysis126 Questions
Exam 15: Chi-Square Applications94 Questions
Exam 16: Decision Making and Payoff Tables in Investment Scenarios151 Questions
Select questions type
At a recent automobile show, a sample of 125 people produced the following results. Use the 0.05
Significance level to determine if there is a relationship between age and model preferred. 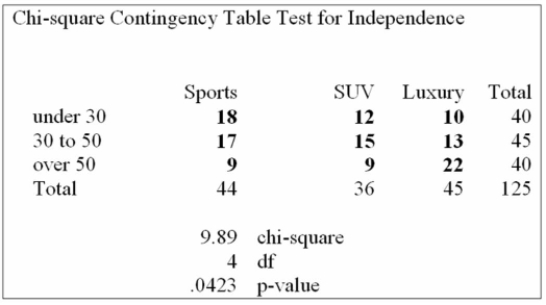 Based on the analysis above, what can be concluded?
(Multiple Choice)
5.0/5  (35)
(35)
At a recent automobile show, a sample of 135 people produced the following results. Use the 0.01
Significance level to determine if there is a relationship between age and model preferred. 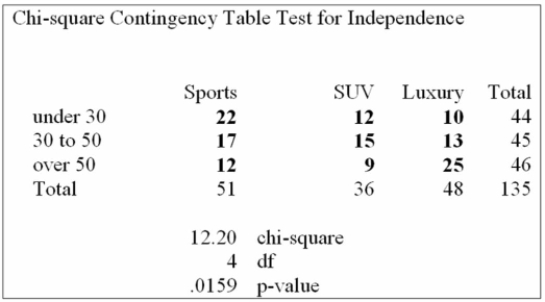 Based on the analysis above, what can be concluded?
(Multiple Choice)
4.9/5 (31)
The educational level and the social activity of a sample of executives follow. 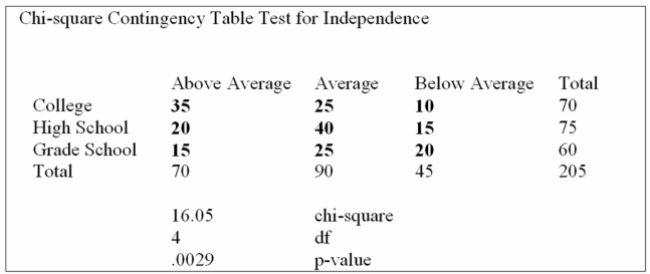 Using the data from this Megastat printout, you determine:
(Multiple Choice)
4.8/5 (35)
Canadian Accounting classifies accounts receivable as "current", "late", and "not collectible".
Industry figures show that 60% of A/R are current, 30% are late, and 10% are uncollectible. A law
firm in Markham Ontario has 500 accounts receivable: 320 are current, 100 are late and 80 are not
Collectible. Are these numbers in agreement with the industry distribution? 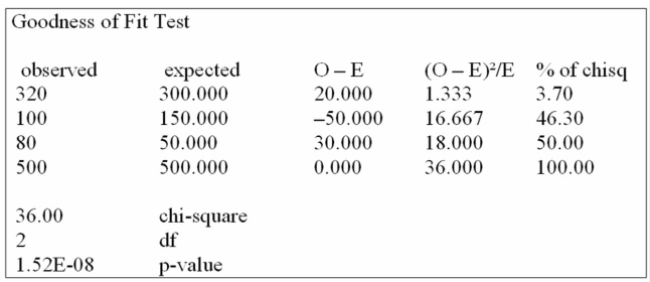 Using the data from this Megastat printout, you determine:
(Multiple Choice)
4.8/5 (36)
Six people have declared their intentions to run for a trustee seat in the next local election. A
Political poll is conducted during the campaign among 1,020 voters to determine if there is any clear
Preference among the voters. The responses are shown below. 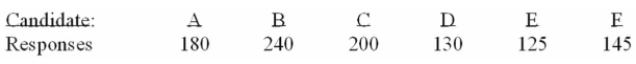 What is the critical value at the 1% level of significance?
(Multiple Choice)
4.9/5 (38)
A survey of the opinions of property owners about a street widening project was taken to determine
Whether the resulting opinion was related to the distance of front footage. A randomly selected
Sample of 100 property owners was contacted and the results are shown below.  How many degrees of freedom are there?
(Multiple Choice)
4.9/5 (32)
i. The claim that "male and female University of Toledo students prefer different parking lots on
Campus" is an example of a chi-square null hypothesis.
ii. For a contingency table, the expected frequency for a cell is found by dividing the row total by the
Grand total.
iii. For contingency table analysis using the chi-square test, multiplying the number of rows minus 1
By the number of columns minus 1 will give you the degrees of freedom.
(Multiple Choice)
4.7/5 (30)
i. Nonparametric tests require no assumptions about the shape of the population distribution.
ii. Tests of hypotheses for nominal or ordinal levels of measurement are called nonparametric or
Distribution-free tests.
iii. There is not one, but a family of chi-square distributions. There is a chi-square distribution for 1
Degree of freedom, another for 2 degrees of freedom, another for 3 degrees of freedom, and so on.
(Multiple Choice)
4.9/5 (35)
i. The shape of the chi-square distribution changes for each number of degrees of freedom.
ii. The minimum computed value of chi-square is zero.
iii. The chi-square distribution is a positively skewed distribution.
(Multiple Choice)
4.7/5 (29)
The personnel manager is concerned about absenteeism. She decides to sample the records to
Determine if absenteeism is distributed evenly throughout the six-day workweek. The null
Hypothesis to be tested is: Absenteeism is distributed evenly throughout the week. The 0.01 level is
To be used. The sample results are: 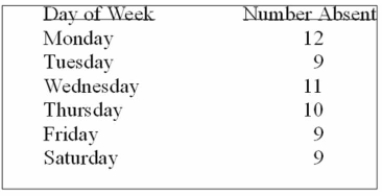 What kind of frequencies are the numbers 12, 9, 11, 10, and 9 called?
(Multiple Choice)
4.9/5 (33)
The educational level and the social activity of a sample of executives follow. 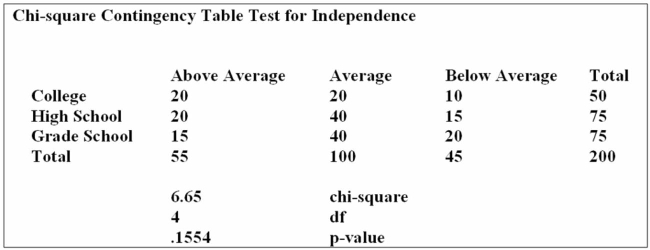 Using the data from this Megastat printout, you determine:
(Multiple Choice)
4.7/5 (35)
The personnel manager is concerned about absenteeism. She decides to sample the records to
Determine if absenteeism is distributed evenly throughout the six-day workweek. The null
Hypothesis to be tested is: Absenteeism is distributed evenly throughout the week. The 0.01 level is
To be used. The sample results are:  What is the expected frequency?
(Multiple Choice)
4.8/5 (28)
A student asked a statistics professor if grades were marked "on the curve." The professor decided
To give the student a project to determine if last year's statistics grades were normally distributed.
The professor told the student that last year's mean mark was 70 with a standard deviation of 10
And to use the following results. 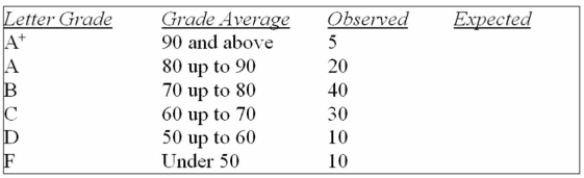 What is the expected number of C's?
(Multiple Choice)
4.9/5 (36)
A survey of the opinions of property owners about a street widening project was taken to determine
Whether the resulting opinion was related to the distance of front footage. A randomly selected
Sample of 100 property owners was contacted and the results are shown below. 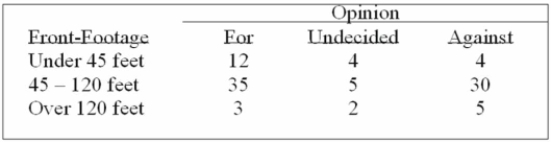 What kind of table is this classification? Determine the null and alternate hypotheses.
(Multiple Choice)
4.8/5 (37)
i. Chi-square goodness-of-fit test is the appropriate statistical test to use when you wish to
Determine how well an observed set of data fits an expected set of data.
ii. The null hypothesis in the goodness-of-fit test is that there is no difference.
iii. The alternative hypothesis states that there is a difference between the observed frequencies
And the expected frequencies in a goodness-of-fit test.
(Multiple Choice)
4.8/5 (39)
In a chi-square goodness-of-fit-test, the larger the difference between the set of expected
Frequencies and the set of observed frequencies:
(Multiple Choice)
4.9/5 (39)
A distributor of personal computers has five locations in the city. The sales in units for the first
Quarter of the year were as follows: 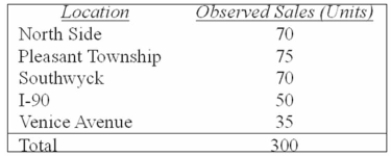 What is the critical value at the 0.01 level of risk?
(Multiple Choice)
4.8/5 (38)
A survey of the opinions of property owners about a street widening project was taken to determine
Whether the resulting opinion was related to the distance of front footage. A randomly selected
Sample of 100 property owners was contacted and the results are shown below. 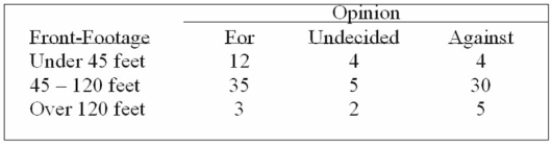 What is the critical value at the 5% level of significance?
(Multiple Choice)
4.9/5 (37)
Three new colors have been proposed for the Jeep Grand Cherokee vehicle. They are silvered-
Blue, almond, and willow green. The null hypothesis for a goodness-of-fit test would be
(Multiple Choice)
4.9/5 (33)
Filters
- Essay(0)
- Multiple Choice(0)
- Short Answer(0)
- True False(0)
- Matching(0)