Exam 5: Accumulated Change: the Definite Integral
Exam 1: Functions and Change204 Questions
Exam 2: Rate of Change: the Derivative132 Questions
Exam 3: Shortcuts to Differentiation178 Questions
Exam 4: Using the Derivative94 Questions
Exam 5: Accumulated Change: the Definite Integral93 Questions
Exam 6: Antiderivatives and Applications122 Questions
Exam 7: Probability68 Questions
Exam 8: Functions of Several Variables134 Questions
Exam 9: Mathematical Modeling Using Differential Equations121 Questions
Exam 10: Geometric Series65 Questions
Select questions type
Below is a graph of the rate r in arrivals per minute at which students line up for breakfast. The first people arrive at 6:50 am and the line opens at 7:00 am. The line serves students at a constant rate of 20 students per minute. Estimate the rate at which the line is growing in length at 7:14 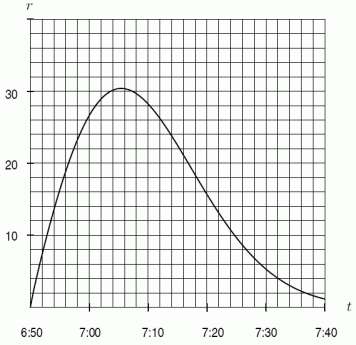
(Multiple Choice)
4.8/5  (32)
(32)
The graph of  is shown below. If f is increasing at x = -1, which of the following must be true? Choose all that apply.
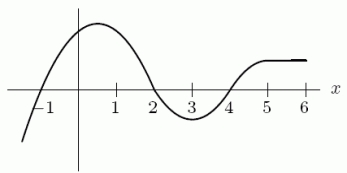

(Multiple Choice)
4.8/5 (38)
Consider the function  , as shown in the following figure. Taking
  , find the upper sum estimate for
  . Round to 3 decimal places.
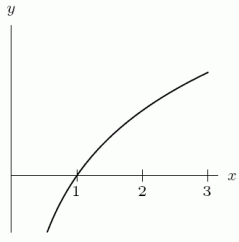
(Short Answer)
4.7/5 (37)
The Ethnic food line at the Cougar Eat can serve customers at the rate of about 30 per hour. From 10 am until 4 pm one day, the rate R at which customers entered then line was about 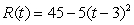 customers per hour at t hours past 10 am. About what time did a waiting line form?
(Multiple Choice)
4.8/5 (30)
Estimate the area of the region bounded by  ,
,  ,
,  , and
, and  . Round to 2 decimal places.
(Short Answer)
4.7/5 (38)
Equal numbers of two different species of ground squirrels are introduced into an area at time t = 0, with t in years. They have the growth rates shown in the following figure. Which species will have a larger population after 13 years? 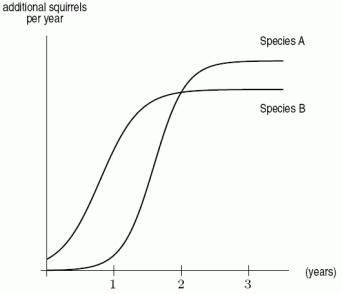
(Multiple Choice)
4.8/5 (36)
The marginal cost in dollars per unit of producing q units is given in the following table. Estimate the total variable cost to produce 25 units. 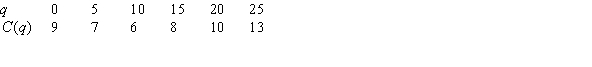
(Short Answer)
4.9/5 (45)
The table below gives the average rate of monthly U.S. field production of crude oil for each decade from the 1920s through the 2000s (based on estimates calculated from the US Energy Information Administration). Use this data to estimate the total US field production from the 1920s to the 2000s. Note that there are 120 months in a decade. Production is given in millions of barrels per month. 
(Multiple Choice)
4.9/5 (38)
Which of the following is the best approximation for  , where f is shown in the following figure?
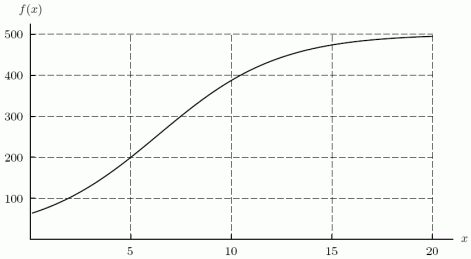
(Multiple Choice)
4.8/5 (30)
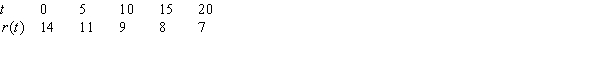
The following table gives the rate, in cubic centimeters, that air is leaking from a balloon t seconds after it is inflated. Let  be that rate. What is the meaning of
  ?
? 
(Multiple Choice)
4.9/5 (35)
Suppose  . Find the total area bounded by
  ,
,  ,
,  , and
, and  . Round to 1 decimal place.
(Short Answer)
4.9/5 (33)
Estimate the area of the region under the curve  and above the x-axis for
  . Round to 2 decimal places.
(Short Answer)
4.9/5 (43)
Use a calculator to estimate  . Round your answer to 2 decimal places.
(Short Answer)
5.0/5 (31)
If  represents the rate at which a country's debt is growing, then the increase in its debt between 1980 and 1985 is given by
(Multiple Choice)
5.0/5 (42)
Water is flowing into a container at an increasing rate, as shown in the following table. Give a lower estimate for the total number of gallons of water in the container after 30 minutes. 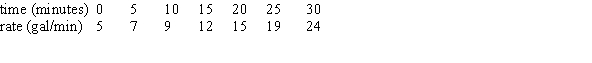
(Short Answer)
4.9/5 (43)
Your velocity, in meters per second, is given by  , where t is time in seconds. Estimate your distance traveled over the first 6 seconds.
(Multiple Choice)
4.8/5 (40)
According to the European Journal of Clinical Pharmacology, the half-life of the ACE inhibitor lisinopril increases from 12 hours in people with normal kidney function to 24 hours in people with mild kidney failure. A group of patients takes a 5-mg dose of lisinopril at 6 am. The rate that lisinopril decreases in the bloodstream is given by  for normal kidney function and
  for impaired kidney function.
After 16 hours, what is the difference of the amount of lisinopril in the bloodstream between a person with normal kidney function and a person with impaired kidney function?
for impaired kidney function.
After 16 hours, what is the difference of the amount of lisinopril in the bloodstream between a person with normal kidney function and a person with impaired kidney function?
(Short Answer)
4.8/5 (32)
Filters
- Essay(0)
- Multiple Choice(0)
- Short Answer(0)
- True False(0)
- Matching(0)