Exam 5: Accumulated Change: the Definite Integral
Exam 1: Functions and Change204 Questions
Exam 2: Rate of Change: the Derivative132 Questions
Exam 3: Shortcuts to Differentiation178 Questions
Exam 4: Using the Derivative94 Questions
Exam 5: Accumulated Change: the Definite Integral93 Questions
Exam 6: Antiderivatives and Applications122 Questions
Exam 7: Probability68 Questions
Exam 8: Functions of Several Variables134 Questions
Exam 9: Mathematical Modeling Using Differential Equations121 Questions
Exam 10: Geometric Series65 Questions
Select questions type
Sales of a new product are increasing at a rate of  units per month, where t is time in months since the product was introduced. How many units were sold the first 3 months since the product was introduced? Set up an integral and use a calculator to evaluate it to the nearest whole unit.
(Short Answer)
4.8/5  (38)
(38)
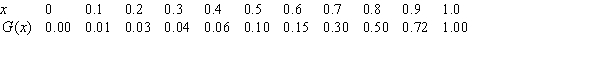
Data for a function G is given in the following table. Estimate  (to 3 decimal places). Average upper and lower sums.
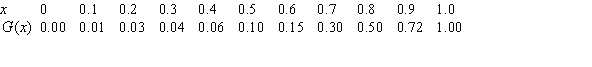
(Short Answer)
4.7/5 (31)
If a function is concave up, then the left-hand Reimann sums are always less than the right-hand Reimann sums with the same subdivisions, over the same intervals.
(True/False)
4.9/5 (33)
A reagent is cooling in a laboratory instrument. Explain in words what 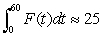 means if
  is the temperature of the reagent in degrees Fahrenheit and t is time in minutes.
(Short Answer)
4.8/5 (41)
Use the following graph to estimate  using the left Riemann sum with three terms.
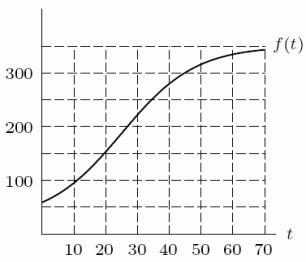
(Short Answer)
5.0/5 (37)
Estimate the area above the curve  and below y = 4 for
  . Round to 2 decimal places.
(Short Answer)
4.9/5 (39)
Below is a graph of the rate r in arrivals per minute at which students line up for breakfast. The first people arrive at 6:50 am and the line opens at 7:00 am. The line serves students at a constant rate of 20 students per minute. Estimate the length of the line at 7:10. 
(Multiple Choice)
4.8/5 (39)
Use the following figure to estimate  (average left- and right-hand sums).
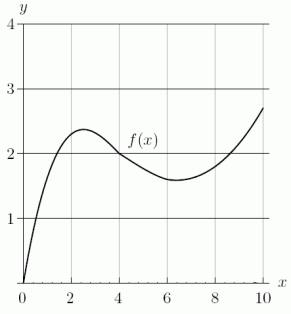
(Short Answer)
4.8/5 (33)
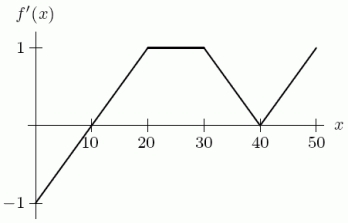
The Ethnic food line at the Cougar Eat can serve customers at the rate of about 30 per hour. From 10 am until 4 pm one day, the rate R at which customers entered then line was about 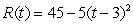 customers per hour at t hours past 10 am. About how many customers were served between 10 am and 4 pm that day? Round to the nearest whole number.
(Short Answer)
4.8/5 (35)
In the following graph, does  appear to be positive, negative, or zero?
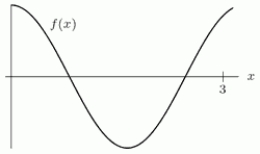
(Short Answer)
5.0/5 (32)
The graph of  is shown in the following figure. Given that
  , find
  .
. 
(Short Answer)
4.9/5 (43)
A. Find a 4-term left Riemann sum approximation for the integral  . Round to 1 decimal place.
B. Is your answer in part (A) an underestimate or an overestimate?
. Round to 1 decimal place.
B. Is your answer in part (A) an underestimate or an overestimate?
(Short Answer)
4.8/5 (36)
Two cars start at the same time and travel in the same direction along a straight road. The following figure gives the velocity, v, of each car as a function of time, t. Which car reached the larger maximum velocity? 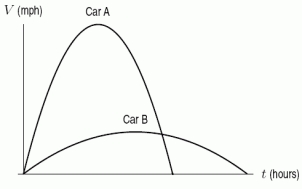
(Multiple Choice)
4.9/5 (32)
At time t, in seconds, the velocity v, in feet per second, of a car is given by 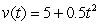 for
for  . A second car travels exactly 20 feet per second faster than the first car. How much greater will the left- and right-hand estimates for the distance traveled by the second car be that the left- and right-hand estimates for the distance traveled by the first car?
(Short Answer)
4.8/5 (24)
Data for a function G is given in the following table. Estimate  .
. 
(Short Answer)
4.9/5 (38)
Your rich eccentric friend has hired you to cover his back yard with grass and patio stone. If the southwest corner of his yard is taken as the origin, with the x-axis pointing eastward and distances measured in feet, then the boundaries of the yard are the lines x = 0, x = 100, y = 0, and f(x) = 110-0.5x. The border between grass and stone is 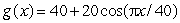 , with grass covering all of the yard south of the curve. This border also bounds one side of the pool, the other side of the pool being surrounded by the curve
 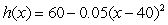 . All of the rest of the yard is to be covered by stone. Estimate, to the nearest square yard, the area of the grass.
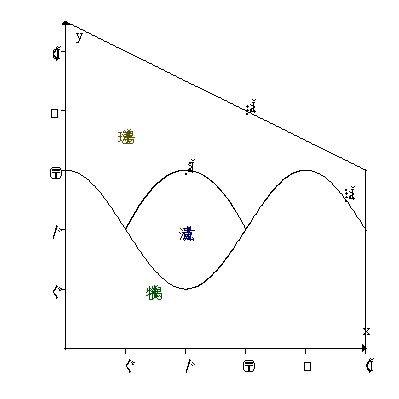
(Short Answer)
4.7/5 (39)
At time t, in seconds, your velocity, v, in meters per second, is given by  for
for  . Use
. Use  to estimate how many meters you traveled during this time.
(Short Answer)
4.8/5 (46)
If  is a production rate, measured in items per hour, then how many items were produced from hour 2 to hour 6?
(Short Answer)
4.8/5 (32)
Filters
- Essay(0)
- Multiple Choice(0)
- Short Answer(0)
- True False(0)
- Matching(0)