Exam 5: Accumulated Change: the Definite Integral
Exam 1: Functions and Change204 Questions
Exam 2: Rate of Change: the Derivative132 Questions
Exam 3: Shortcuts to Differentiation178 Questions
Exam 4: Using the Derivative94 Questions
Exam 5: Accumulated Change: the Definite Integral93 Questions
Exam 6: Antiderivatives and Applications122 Questions
Exam 7: Probability68 Questions
Exam 8: Functions of Several Variables134 Questions
Exam 9: Mathematical Modeling Using Differential Equations121 Questions
Exam 10: Geometric Series65 Questions
Select questions type
A local business produces souvenirs for the tourist trade. The business has fixed costs of $6 thousand, and it costs an additional $9.93 thousand in variable costs to produce 10 thousand souvenirs. A consultant told the business that their marginal cost function is  dollars per thousand souvenirs. What will it cost to increase their production to 19 thousand souvenirs?
(Multiple Choice)
4.8/5  (24)
(24)
The marginal cost function for a manufacturing company is given by  dollars per box, where q is the number of boxes manufactured. If
  , find the total cost of manufacturing 10 boxes. Round to the nearest dollar.
(Short Answer)
4.7/5 (32)
If the velocity function  is measured in feet per second and t gives time in seconds, what are the units of measurement for
  ?
?
(Multiple Choice)
4.8/5 (34)
The Ethnic food line at the Cougar Eat can serve customers at the rate of about 30 per hour. From 10 am until 4 pm one day, the rate R at which customers entered then line was about  customers per hour at t hours past 10 am. About when was the waiting line the longest?
(Multiple Choice)
4.8/5 (32)
At time t, in seconds, the velocity v, in miles per hour, of a car is given by  for
for  . Use
. Use  to estimate how many miles were traveled during this time (average left- and right-hand sums).
(Short Answer)
4.8/5 (29)
The balance in an investment account increases at a rate of 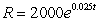 dollars per year, where t is time in years since 2000. Make a table of values for R and use it to give a n upper estimate for the total change in the value of the account between 2000 and 2004.
(Multiple Choice)
4.8/5 (28)
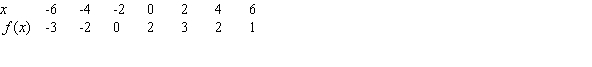
Use the following table to estimate the area between  and the x-axis on the interval
  .
. 
(Multiple Choice)
4.8/5 (45)
Estimate the area of the region under the curve  for
for  . Round to 2 decimal places.
(Short Answer)
4.9/5 (40)
A water line made of PVC decays and eventually breaks. The rate that water flows into the street from the break is given by the function 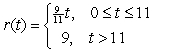 , in gallons per hour. Use a calculator or graph to determine how many gallons of water have been lost from the water line break after 13 hours.
(Multiple Choice)
4.8/5 (38)
Suppose  and
and 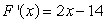 . Then
  has a local _______ (maximum/minimum) on
  at x = _____.
(Short Answer)
4.9/5 (35)
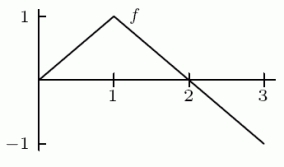
The graph of f is shown in the following figure. Find  if
if  and
and  .
. 
(Short Answer)
4.9/5 (37)
Filters
- Essay(0)
- Multiple Choice(0)
- Short Answer(0)
- True False(0)
- Matching(0)