Exam 2: Organizing and Visualizing Data
Exam 1: Introduction145 Questions
Exam 2: Organizing and Visualizing Data210 Questions
Exam 3: Numerical Descriptive Measures153 Questions
Exam 4: Basic Probability171 Questions
Exam 5: Discrete Probability Distributions218 Questions
Exam 6: The Normal Distribution and Other Continuous Distributions191 Questions
Exam 7: Sampling and Sampling Distributions197 Questions
Exam 8: Confidence Interval Estimation196 Questions
Exam 9: Fundamentals of Hypothesis Testing: One-Sample Tests165 Questions
Exam 10: Two-Sample Tests210 Questions
Exam 11: Analysis of Variance213 Questions
Exam 12: Chi-Square Tests and Nonparametric Tests201 Questions
Exam 13: Simple Linear Regression213 Questions
Exam 14: Introduction to Multiple Regression355 Questions
Exam 15: Multiple Regression Model Building96 Questions
Exam 16: Time-Series Forecasting168 Questions
Exam 17: Statistical Applications in Quality Management133 Questions
Exam 18: A Roadmap for Analyzing Data54 Questions
Select questions type
TABLE 2-5
The following are the duration in minutes of a sample of long-distance phone calls made within the continental United States reported by one long-distance carrier.
Relative
Time (in Minutes) Relative Frequency 0 but less than 5 0.37 5 but less than 10 0.22 10 but less than 15 0.15 15 but less than 20 0.10 20 but less than 25 0.07 25 but less than 30 0.07 30 or more 0.02
-Referring to Table 2-5, what is the cumulative relative frequency for the percentage of calls that lasted under 20 minutes?
(Multiple Choice)
4.7/5  (32)
(32)
TABLE 2-4
A survey was conducted to determine how people rated the quality of programming available on television. Respondents were asked to rate the overall quality from 0 (no quality at all) to 100 (extremely good quality). The stem-and-leaf display of the data is shown below.
Stem Leaves 3 24 4 03478999 5 0112345 6 12566 7 01 8 9 2
-Referring to Table 2-4, what percentage of the respondents rated overall television quality with a rating of 50 or below?
(Multiple Choice)
4.9/5 (42)
TABLE 2-12
The table below contains the opinions of a sample of 200 people broken down by gender about the latest congressional plan to eliminate anti-trust exemptions for professional baseball.
For Neutral Aqainst Totals Female 38 54 12 104 Male 12 36 48 96 Totals 50 90 60 200
-Referring to Table 2-12, ________ percent of the 200 were males.
(Short Answer)
4.8/5 (32)
TABLE 2-8
The Stem-and-Leaf display represents the number of times in a year that a random sample of 100 "lifetime" members of a health club actually visited the facility.
Stem Leaves 0 0122222233333344566666667789999 1 11111222234444455669999 2 00011223455556889 3 0000446799 4 0111345567 5 0077 6 8 7 67 8 3 9 0247
-Referring to Table 2-8, if a frequency distribution with equal sized classes was made from this data, and the first class was "0 but less than 10," the relative frequency of the last class would be ________.
(Short Answer)
4.8/5 (40)
TABLE 2-11
The ordered array below resulted from selecting a sample of 25 batches of 500 computer chips and determining how many in each batch were defective.
Defects 1 2 4 4 5 5 6 7 9 9 12 12 15 17 20 21 23 23 25 26 27 27 28 29 29
-Referring to Table 2-11, if a frequency distribution for the defects data is constructed, using "0 but less than 5" as the first class, the relative frequency of the "15 but less than 20" class would be ________.
(Short Answer)
4.8/5 (42)
TABLE 2-13
Given below is the stem-and-leaf display representing the amount of detergent used in gallons (with leaves in tenths of gallons) in a day by 25 drive-through car wash operations in Phoenix.
11 | 135566777
-Referring to Table 2-13, construct a relative frequency or percentage distribution for the detergent data, using "9.0 but less than 10.0" as the first class.
(Essay)
4.8/5 (44)
TABLE 2-14
The table below contains the number of people who own a portable DVD player in a sample of 600 broken down by gender.
Own a Portable DVD Player Male Female Yes 96 40 No 224 240
-Referring to Table 2-14, construct a table of column percentages.
(Essay)
4.9/5 (38)
TABLE 2-12
The table below contains the opinions of a sample of 200 people broken down by gender about the latest congressional plan to eliminate anti-trust exemptions for professional baseball.
For Neutral Aqainst Totals Female 38 54 12 104 Male 12 36 48 96 Totals 50 90 60 200
-Referring to Table 2-12, if the sample is a good representation of the population, we can expect ________ percent of the males in the population will be against the plan.
(Short Answer)
4.9/5 (27)
TABLE 2-7
The Stem-and-Leaf display below contains data on the number of months between the date a civil suit is filed and when the case is actually adjudicated for 50 cases heard in superior court.
Stem Leaves 1 234447899 2 22223455678889 3 0011135778 4 02345579 5 112466 6 158
-Referring to Table 2-7, locate the first leaf, i.e., the lowest valued leaf with the lowest valued stem. This represents a wait of ________ months.
(Short Answer)
4.8/5 (32)
TABLE 2-9
The frequency distribution below represents the rents of 250 randomly selected federally subsidized apartments in a small town.
Rent in \ Frequency 300 but less than 400 113 400 but less than 500 85 500 but less than 600 32 600 but less than 700 16 700 but less than 800 4
-Referring to Table 2-9, the percentage of apartments renting for less than $600 is ________.
(Essay)
4.8/5 (34)
Tim was planning for a meeting with his boss to discuss a raise in his annual salary. In preparation, he wanted to use the Consumer Price Index to determine the percentage increase in his real (inflation-adjusted)salary over the last three years. Which of the 4 methods of data collection was involved when he used the Consumer Price Index?
(Multiple Choice)
4.9/5 (40)
TABLE 2-12
The table below contains the opinions of a sample of 200 people broken down by gender about the latest congressional plan to eliminate anti-trust exemptions for professional baseball.
For Neutral Aqainst Totals Female 38 54 12 104 Male 12 36 48 96 Totals 50 90 60 200
-Referring to Table 2-12, ________ percent of the 200 were not neutral.
(Short Answer)
4.8/5 (30)
TABLE 2-14
The table below contains the number of people who own a portable DVD player in a sample of 600 broken down by gender.
Own a Portable DVD Player Male Female Yes 96 40 No 224 240
-Referring to Table 2-14, ________ percent of the 600 were females who owned a portable DVD.
(Short Answer)
4.8/5 (37)
You have collected data on the number of U.S. households actively using online banking and/or online bill payment from 1995 to 2010. Which of the following is the best for presenting the data?
(Multiple Choice)
4.9/5 (39)
A ________ is a summary table in which numerical data are tallied into class intervals or categories.
(Short Answer)
4.8/5 (24)
TABLE 2-10
The histogram below represents scores achieved by 200 job applicants on a personality profile.
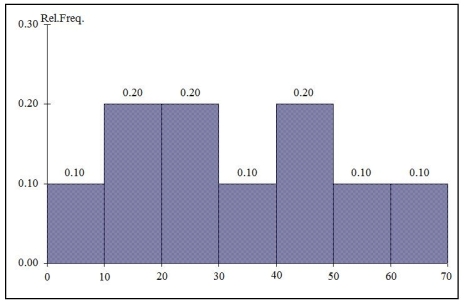 -Referring to the histogram from Table 2-10, half of the job applicants scored below ________.
(Short Answer)
4.8/5 (39)
The percentage distribution cannot be constructed from the frequency distribution directly.
(True/False)
4.9/5 (38)
When constructing a frequency distribution, classes should be selected so that they are of equal width.
(True/False)
4.9/5 (29)
You have collected data on the monthly seasonally adjusted civilian unemployment rate for the United States from 1998 to 2010. Which of the following is the best for presenting the data?
(Multiple Choice)
4.7/5 (28)
Filters
- Essay(0)
- Multiple Choice(0)
- Short Answer(0)
- True False(0)
- Matching(0)