Exam 2: Organizing and Visualizing Data
Exam 1: Introduction145 Questions
Exam 2: Organizing and Visualizing Data210 Questions
Exam 3: Numerical Descriptive Measures153 Questions
Exam 4: Basic Probability171 Questions
Exam 5: Discrete Probability Distributions218 Questions
Exam 6: The Normal Distribution and Other Continuous Distributions191 Questions
Exam 7: Sampling and Sampling Distributions197 Questions
Exam 8: Confidence Interval Estimation196 Questions
Exam 9: Fundamentals of Hypothesis Testing: One-Sample Tests165 Questions
Exam 10: Two-Sample Tests210 Questions
Exam 11: Analysis of Variance213 Questions
Exam 12: Chi-Square Tests and Nonparametric Tests201 Questions
Exam 13: Simple Linear Regression213 Questions
Exam 14: Introduction to Multiple Regression355 Questions
Exam 15: Multiple Regression Model Building96 Questions
Exam 16: Time-Series Forecasting168 Questions
Exam 17: Statistical Applications in Quality Management133 Questions
Exam 18: A Roadmap for Analyzing Data54 Questions
Select questions type
When comparing two or more large sets of numerical data, the distributions being developed should use the same ________.
(Short Answer)
4.8/5  (38)
(38)
TABLE 2-12
The table below contains the opinions of a sample of 200 people broken down by gender about the latest congressional plan to eliminate anti-trust exemptions for professional baseball.
For Neutral Aqainst Totals Female 38 54 12 104 Male 12 36 48 96 Totals 50 90 60 200
-Referring to Table 2-12, ________ percent of the 200 were females who were either neutral or against the plan.
(Short Answer)
4.7/5 (40)
TABLE 2-13
Given below is the stem-and-leaf display representing the amount of detergent used in gallons (with leaves in tenths of gallons) in a day by 25 drive-through car wash operations in Phoenix.
11 | 135566777
-Referring to Table 2-13, if a frequency distribution for the amount of detergent used is constructed, using "9.0 but less than 10.0 gallons" as the first class, the frequency of the "11.0 but less than 12.0 gallons" class would be ________.
(Short Answer)
4.8/5 (28)
TABLE 2-3
Every spring semester, the School of Business coordinates a luncheon with local business leaders for graduating seniors, their families, and friends. Corporate sponsorship pays for the lunches of each of the seniors, but students have to purchase tickets to cover the cost of lunches served to guests they bring with them. The following histogram represents the attendance at the senior luncheon, where X is the number of guests each graduating senior invited to the luncheon and f is the number of graduating seniors in each category.
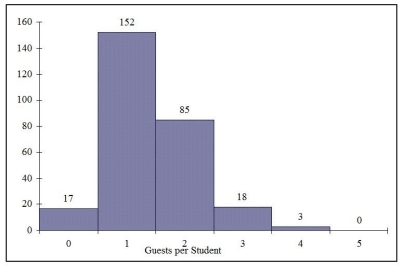 -Referring to the histogram from Table 2-3, how many graduating seniors attended the luncheon?
(Multiple Choice)
4.9/5 (39)
TABLE 2-12
The table below contains the opinions of a sample of 200 people broken down by gender about the latest congressional plan to eliminate anti-trust exemptions for professional baseball.
For Neutral Aqainst Totals Female 38 54 12 104 Male 12 36 48 96 Totals 50 90 60 200
-Referring to Table 2-12, of those neutral in the sample, ________ percent were males.
(Short Answer)
4.8/5 (24)
TABLE 2-7
The Stem-and-Leaf display below contains data on the number of months between the date a civil suit is filed and when the case is actually adjudicated for 50 cases heard in superior court.
Stem Leaves 1 234447899 2 22223455678889 3 0011135778 4 02345579 5 112466 6 158
-Referring to Table 2-7, ________ percent of the cases were not adjudicated within the first 4 years.
(Short Answer)
4.9/5 (42)
TABLE 2-14
The table below contains the number of people who own a portable DVD player in a sample of 600 broken down by gender.
Own a Portable DVD Player Male Female Yes 96 40 No 224 240
-Referring to Table 2-14, of the females in the sample, ________ percent did not own a portable DVD.
(Short Answer)
4.7/5 (42)
TABLE 2-16
The figure below is the percentage polygon for the amount of calories for a sample of 36 pizzas products where the upper limits of the intervals are: 310, 340, 370, 400 and 430.
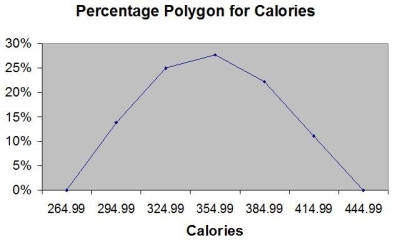 -Referring to Table 2-16, roughly what percentage of pizza products contains between 400 and 430 calories?
(Multiple Choice)
4.7/5 (38)
The point halfway between the boundaries of each class interval in a grouped frequency distribution is called the ________.
(Short Answer)
4.9/5 (30)
TABLE 2-8
The Stem-and-Leaf display represents the number of times in a year that a random sample of 100 "lifetime" members of a health club actually visited the facility.
Stem Leaves 0 0122222233333344566666667789999 1 11111222234444455669999 2 00011223455556889 3 0000446799 4 0111345567 5 0077 6 8 7 67 8 3 9 0247
-Referring to Table 2-8, if a frequency distribution with equal sized classes was made from this data, and the first class was "0 but less than 10," the frequency of the fifth class would be ________.
(Short Answer)
4.8/5 (33)
Histograms are used for numerical data while bar charts are suitable for categorical data.
(True/False)
4.8/5 (32)
Data on the number of part-time hours students at a public university worked in a week were collected. Which of the following is the best chart for presenting the information?
(Multiple Choice)
4.8/5 (27)
TABLE 2-10
The histogram below represents scores achieved by 200 job applicants on a personality profile.
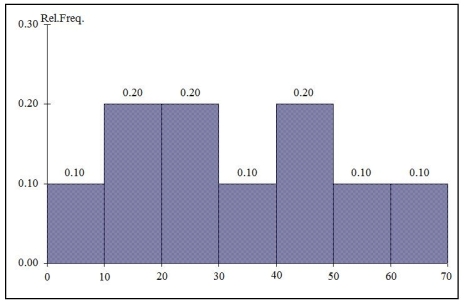 -Referring to the histogram from Table 2-10, the number of job applicants who scored between 30 and below 60 is ________.
(Short Answer)
4.9/5 (36)
The main principle behind the Pareto chart is the ability to separate the "vital few" from the "trivial many."
(True/False)
4.7/5 (34)
TABLE 2-14
The table below contains the number of people who own a portable DVD player in a sample of 600 broken down by gender.
Own a Portable DVD Player Male Female Yes 96 40 No 224 240
-Referring to Table 2-14, ________ percent of the 600 did not own a portable DVD.
(Short Answer)
4.9/5 (32)
TABLE 2-5
The following are the duration in minutes of a sample of long-distance phone calls made within the continental United States reported by one long-distance carrier.
Relative
Time (in Minutes) Relative Frequency 0 but less than 5 0.37 5 but less than 10 0.22 10 but less than 15 0.15 15 but less than 20 0.10 20 but less than 25 0.07 25 but less than 30 0.07 30 or more 0.02
-Referring to Table 2-5, if 100 calls were randomly sampled, how many calls lasted 15 minutes or longer?
(Multiple Choice)
4.8/5 (34)
When constructing charts, the following is plotted at the class midpoints:
(Multiple Choice)
4.8/5 (34)
A good choice for the number of class groups to use in constructing frequency distribution is to have at least 5 but no more than 15 class groups.
(True/False)
4.8/5 (32)
TABLE 2-14
The table below contains the number of people who own a portable DVD player in a sample of 600 broken down by gender.
Own a Portable DVD Player Male Female Yes 96 40 No 224 240
-Referring to Table 2-14, construct a table of row percentages.
(Essay)
4.8/5 (31)
TABLE 2-17
The following table presents total retail sales in millions of dollars for the leading apparel companies during April 2009 and April 2010.
APPAREL COMPANY April2009 April 2010 Gap 1,159.00 962 TJX 781.7 899 Limited 596.5 620.4 Kohl's 544.9 678.9 Nordstrom 402.6 418.3 Talbots 139.9 130.1 Ann Taylor 114.2 124.8
-Referring to Table 2-17, among the 8 stores, ________ saw a sales decline.
(Short Answer)
4.8/5 (38)
Filters
- Essay(0)
- Multiple Choice(0)
- Short Answer(0)
- True False(0)
- Matching(0)