Exam 2: Organizing and Visualizing Data
Exam 1: Introduction145 Questions
Exam 2: Organizing and Visualizing Data210 Questions
Exam 3: Numerical Descriptive Measures153 Questions
Exam 4: Basic Probability171 Questions
Exam 5: Discrete Probability Distributions218 Questions
Exam 6: The Normal Distribution and Other Continuous Distributions191 Questions
Exam 7: Sampling and Sampling Distributions197 Questions
Exam 8: Confidence Interval Estimation196 Questions
Exam 9: Fundamentals of Hypothesis Testing: One-Sample Tests165 Questions
Exam 10: Two-Sample Tests210 Questions
Exam 11: Analysis of Variance213 Questions
Exam 12: Chi-Square Tests and Nonparametric Tests201 Questions
Exam 13: Simple Linear Regression213 Questions
Exam 14: Introduction to Multiple Regression355 Questions
Exam 15: Multiple Regression Model Building96 Questions
Exam 16: Time-Series Forecasting168 Questions
Exam 17: Statistical Applications in Quality Management133 Questions
Exam 18: A Roadmap for Analyzing Data54 Questions
Select questions type
You have collected information on the market share of 5 different search engines used by U.S. Internet users in January 2011. Which of the following is the best for presenting the information?
(Multiple Choice)
4.9/5  (38)
(38)
Which of the following is appropriate for displaying data collected on the different brands of cars students at a major university drive?
(Multiple Choice)
5.0/5 (32)
TABLE 2-12
The table below contains the opinions of a sample of 200 people broken down by gender about the latest congressional plan to eliminate anti-trust exemptions for professional baseball.
For Neutral Aqainst Totals Female 38 54 12 104 Male 12 36 48 96 Totals 50 90 60 200
-Referring to Table 2-12, of the males in the sample, ________ percent were for the plan.
(Short Answer)
4.9/5 (36)
TABLE 2-7
The Stem-and-Leaf display below contains data on the number of months between the date a civil suit is filed and when the case is actually adjudicated for 50 cases heard in superior court.
Stem Leaves 1 234447899 2 22223455678889 3 0011135778 4 02345579 5 112466 6 158
-Referring to Table 2-7, if a frequency distribution with equal sized classes was made from this data, and the first class was "10 but less than 20," the frequency of that class would be ________.
(Short Answer)
4.8/5 (30)
TABLE 2-9
The frequency distribution below represents the rents of 250 randomly selected federally subsidized apartments in a small town.
Rent in \ Frequency 300 but less than 400 113 400 but less than 500 85 500 but less than 600 32 600 but less than 700 16 700 but less than 800 4
-Referring to Table 2-9, ________ apartments rented for at least $400 but less than $600.
(Short Answer)
4.7/5 (30)
TABLE 2-9
The frequency distribution below represents the rents of 250 randomly selected federally subsidized apartments in a small town.
Rent in \ Frequency 300 but less than 400 113 400 but less than 500 85 500 but less than 600 32 600 but less than 700 16 700 but less than 800 4
-Referring to Table 2-9, the class midpoint of the second class is ________.
(Short Answer)
4.9/5 (35)
Given below is the scatter plot of the market value (thousands$)and profit (thousands$)of 50 U.S. companies. There appears to be a negative relationship between market value and profit.
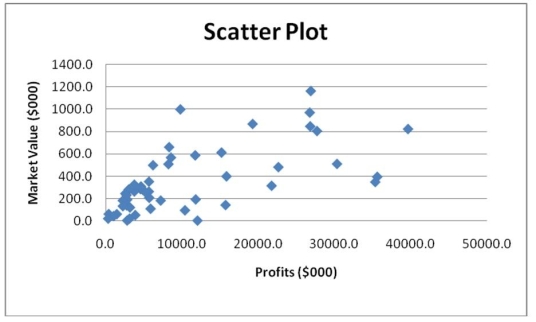
(True/False)
4.9/5 (35)
Apple Computer, Inc. collected information on the age of their customers. The youngest customer was 12 and the oldest was 72. To study the percentage of their customers who are below a certain age, it can use an ogive.
(True/False)
4.8/5 (31)
The personnel director at a large company studied the eating habits of the company's employees. The director noted whether employees brought their own lunches to work, ate at the company cafeteria, or went out to lunch. The goal of the study was to improve the food service at the company cafeteria. This type of data collection would best be considered as
(Multiple Choice)
4.8/5 (42)
TABLE 2-7
The Stem-and-Leaf display below contains data on the number of months between the date a civil suit is filed and when the case is actually adjudicated for 50 cases heard in superior court.
Stem Leaves 1 234447899 2 22223455678889 3 0011135778 4 02345579 5 112466 6 158
-Referring to Table 2-7, the civil suit with the longest wait between when the suit was filed and when it was adjudicated had a wait of ________ months.
(Short Answer)
4.8/5 (34)
TABLE 2-18
The stem-and-leaf display below shows the result of a survey on 50 students on their satisfaction with their school with the higher scores represent higher level of satisfaction.
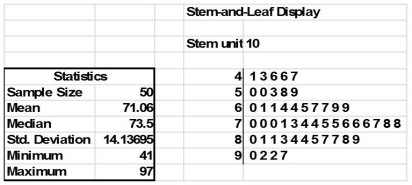 -Referring to Table 2-18, the level of satisfaction is concentrated around 75.
(True/False)
4.8/5 (30)
TABLE 2-10
The histogram below represents scores achieved by 200 job applicants on a personality profile.
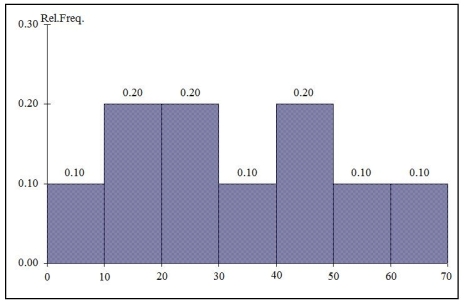 -Referring to the histogram from Table 2-10, the number of job applicants who scored 50 or above is ________.
(Short Answer)
4.8/5 (31)
TABLE 2-14
The table below contains the number of people who own a portable DVD player in a sample of 600 broken down by gender.
Own a Portable DVD Player Male Female Yes 96 40 No 224 240
-Referring to Table 2-14, of the males in the sample, ________ percent owned a portable DVD.
(Short Answer)
4.9/5 (37)
TABLE 2-14
The table below contains the number of people who own a portable DVD player in a sample of 600 broken down by gender.
Own a Portable DVD Player Male Female Yes 96 40 No 224 240
-Referring to Table 2-14, if the sample is a good representation of the population, we can expect ________ percent of the females in the population will not own a portable DVD.
(Short Answer)
4.9/5 (41)
TABLE 2-12
The table below contains the opinions of a sample of 200 people broken down by gender about the latest congressional plan to eliminate anti-trust exemptions for professional baseball.
For Neutral Aqainst Totals Female 38 54 12 104 Male 12 36 48 96 Totals 50 90 60 200
-Referring to Table 2-12, of those for the plan in the sample, ________ percent were females.
(Short Answer)
4.9/5 (27)
TABLE 2-7
The Stem-and-Leaf display below contains data on the number of months between the date a civil suit is filed and when the case is actually adjudicated for 50 cases heard in superior court.
Stem Leaves 1 234447899 2 22223455678889 3 0011135778 4 02345579 5 112466 6 158
-Referring to Table 2-7, the civil suit with the fourth shortest waiting time between when the suit was filed and when it was adjudicated had a wait of ________ months.
(Short Answer)
4.9/5 (37)
Jared was working on a project to look at global warming and accessed an Internet site where he captured average global surface temperatures from 1866. Which of the four methods of data collection was he using?
(Multiple Choice)
5.0/5 (22)
You have collected data on the number of complaints for 6 different brands of automobiles sold in the US in 2006 and in 2010. Which of the following is the best for presenting the data?
(Multiple Choice)
4.8/5 (30)
In general, a frequency distribution should have at least 8 class groups but no more than 20.
(True/False)
4.7/5 (28)
Filters
- Essay(0)
- Multiple Choice(0)
- Short Answer(0)
- True False(0)
- Matching(0)