Exam 2: Organizing and Visualizing Data
Exam 1: Introduction145 Questions
Exam 2: Organizing and Visualizing Data210 Questions
Exam 3: Numerical Descriptive Measures153 Questions
Exam 4: Basic Probability171 Questions
Exam 5: Discrete Probability Distributions218 Questions
Exam 6: The Normal Distribution and Other Continuous Distributions191 Questions
Exam 7: Sampling and Sampling Distributions197 Questions
Exam 8: Confidence Interval Estimation196 Questions
Exam 9: Fundamentals of Hypothesis Testing: One-Sample Tests165 Questions
Exam 10: Two-Sample Tests210 Questions
Exam 11: Analysis of Variance213 Questions
Exam 12: Chi-Square Tests and Nonparametric Tests201 Questions
Exam 13: Simple Linear Regression213 Questions
Exam 14: Introduction to Multiple Regression355 Questions
Exam 15: Multiple Regression Model Building96 Questions
Exam 16: Time-Series Forecasting168 Questions
Exam 17: Statistical Applications in Quality Management133 Questions
Exam 18: A Roadmap for Analyzing Data54 Questions
Select questions type
TABLE 2-10
The histogram below represents scores achieved by 200 job applicants on a personality profile.
 -Referring to the histogram from Table 2-10, ________ percent of the job applicants scored below 50.
(Short Answer)
4.9/5  (29)
(29)
TABLE 2-12
The table below contains the opinions of a sample of 200 people broken down by gender about the latest congressional plan to eliminate anti-trust exemptions for professional baseball.
For Neutral Aqainst Totals Female 38 54 12 104 Male 12 36 48 96 Totals 50 90 60 200
-Referring to Table 2-12, if the sample is a good representation of the population, we can expect ________ percent of those for the plan in the population will be males.
(Short Answer)
4.8/5 (31)
TABLE 2-2
At a meeting of information systems officers for regional offices of a national company, a survey was taken to determine the number of employees the officers supervise in the operation of their departments, where X is the number of employees overseen by each information systems officer.
\ X f 1 7 2 5 3 11 4 8 5 9
-The width of each bar in a histogram corresponds to the
(Multiple Choice)
4.8/5 (30)
TABLE 2-8
The Stem-and-Leaf display represents the number of times in a year that a random sample of 100 "lifetime" members of a health club actually visited the facility.
Stem Leaves 0 0122222233333344566666667789999 1 11111222234444455669999 2 00011223455556889 3 0000446799 4 0111345567 5 0077 6 8 7 67 8 3 9 0247
-Referring to Table 2-8, the person who visited the health club more than anyone else in the sample visited the facility ________ times.
(Short Answer)
4.8/5 (32)
TABLE 2-15
The figure below is the ogive for the amount of fat (in grams) for a sample of 36 pizza products where the upper boundaries of the intervals are: 5, 10, 15, 20, 25, and 30.
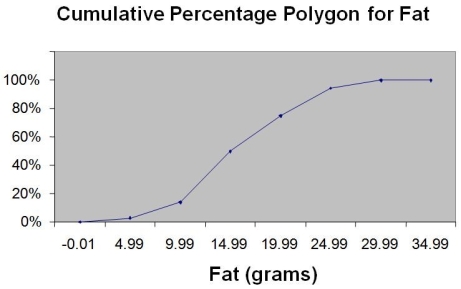 -Referring to Table 2-15, roughly what percentage of pizza products contains less than 10 grams of fat?
(Multiple Choice)
4.9/5 (35)
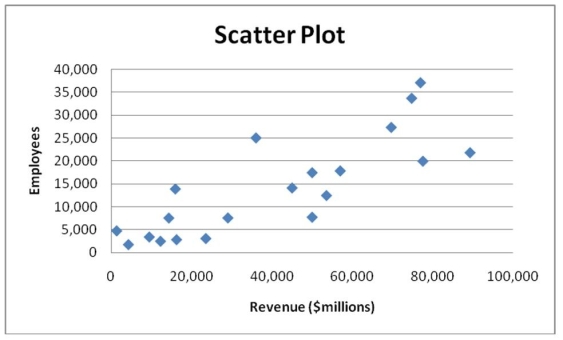
Given below is the scatter plot of the number of employees and the total revenue ($millions)of 20 U.S. companies. There appears to be a positive relationship between total revenue and the number of employees.
(True/False)
4.9/5 (37)
TABLE 2-8
The Stem-and-Leaf display represents the number of times in a year that a random sample of 100 "lifetime" members of a health club actually visited the facility.
Stem Leaves 0 0122222233333344566666667789999 1 11111222234444455669999 2 00011223455556889 3 0000446799 4 0111345567 5 0077 6 8 7 67 8 3 9 0247
-Referring to Table 2-8, if a frequency distribution with equal sized classes was made from this data, and the first class was "0 but less than 10," the class midpoint of the third class would be ________.
(Short Answer)
4.7/5 (31)
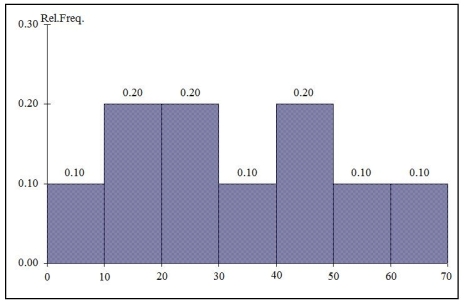
TABLE 2-10
The histogram below represents scores achieved by 200 job applicants on a personality profile.
-Referring to the histogram from Table 2-10, ________ percent of the job applicants scored between 10 and 20.
(Short Answer)
4.9/5 (45)
TABLE 2-11
The ordered array below resulted from selecting a sample of 25 batches of 500 computer chips and determining how many in each batch were defective.
Defects 1 2 4 4 5 5 6 7 9 9 12 12 15 17 20 21 23 23 25 26 27 27 28 29 29
-Referring to Table 2-11, construct a frequency distribution for the defects data, using "0 but less than 5" as the first class.
(Essay)
4.8/5 (40)
TABLE 2-4
A survey was conducted to determine how people rated the quality of programming available on television. Respondents were asked to rate the overall quality from 0 (no quality at all) to 100 (extremely good quality). The stem-and-leaf display of the data is shown below.
Stem Leaves 3 24 4 03478999 5 0112345 6 12566 7 01 8 9 2
-Referring to Table 2-4, what percentage of the respondents rated overall television quality with a rating of 80 or above?
(Multiple Choice)
4.9/5 (36)
You have collected data on the approximate retail price (in $)and the energy cost per year (in $)of 15 refrigerators. Which of the following is the best for presenting the data?
(Multiple Choice)
4.8/5 (32)
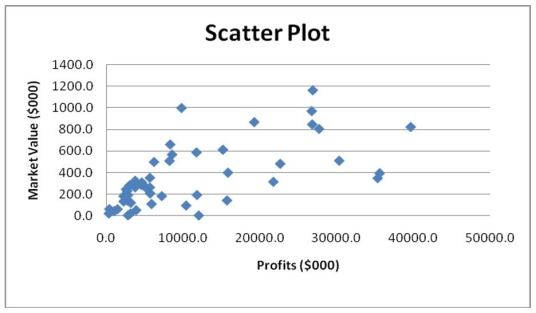
Given below is the scatter plot of the market value (thousands$)and profit (thousands$)of 50 U.S. companies. Higher market values appear to be associated with higher profits.
(True/False)
4.9/5 (38)
TABLE 2-12
The table below contains the opinions of a sample of 200 people broken down by gender about the latest congressional plan to eliminate anti-trust exemptions for professional baseball.
For Neutral Aqainst Totals Female 38 54 12 104 Male 12 36 48 96 Totals 50 90 60 200
-Referring to Table 2-12, ________ percent of the 200 were females who were against the plan.
(Short Answer)
4.7/5 (32)
TABLE 2-3
Every spring semester, the School of Business coordinates a luncheon with local business leaders for graduating seniors, their families, and friends. Corporate sponsorship pays for the lunches of each of the seniors, but students have to purchase tickets to cover the cost of lunches served to guests they bring with them. The following histogram represents the attendance at the senior luncheon, where X is the number of guests each graduating senior invited to the luncheon and f is the number of graduating seniors in each category.
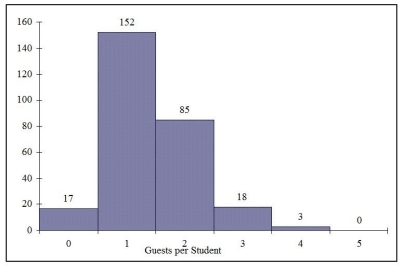 -Referring to the histogram from Table 2-3, if all the tickets purchased were used, how many guests attended the luncheon?
(Multiple Choice)
4.9/5 (34)
TABLE 2-6
A sample of 200 students at a Big-Ten university was taken after the midterm to ask them whether they went bar hopping the weekend before the midterm or spent the weekend studying, and whether they did well or poorly on the midterm. The following table contains the result.
Did Well in Midterm Did Poorly in Midterm Studying for Exam 80 20 Went Bar Hopping 30 70
-Referring to Table 2-6, if the sample is a good representation of the population, we can expect ________ percent of the students in the population to spend the weekend studying and do poorly on the midterm.
(Multiple Choice)
4.8/5 (27)
TABLE 2-18
The stem-and-leaf display below shows the result of a survey on 50 students on their satisfaction with their school with the higher scores represent higher level of satisfaction.
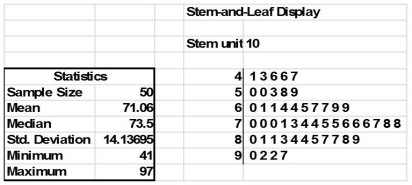 -Referring to Table 2-18, if a student is randomly selected, his/her most likely level of satisfaction will be in the 70s among the 40s, 50s, 60s, 70s, 80s and 90s.
(True/False)
4.8/5 (41)
To determine the width of class interval, divide the number of class groups by the range of the data.
(True/False)
4.7/5 (42)
TABLE 2-14
The table below contains the number of people who own a portable DVD player in a sample of 600 broken down by gender.
Own a Portable DVD Player Male Female Yes 96 40 No 224 240
-Referring to Table 2-14, ________ percent of the 600 owned a portable DVD.
(Short Answer)
4.9/5 (36)
A study attempted to estimate the proportion of Florida residents who were willing to spend more tax dollars on protecting the beaches from environmental disasters. Twenty-five hundred Florida residents were surveyed. What type of data collection procedure was most likely used to collect the data for this study?
(Multiple Choice)
4.9/5 (36)
Filters
- Essay(0)
- Multiple Choice(0)
- Short Answer(0)
- True False(0)
- Matching(0)