Exam 3: Visualizing and Exploring Data
Exam 1: Introduction to Business Analytics50 Questions
Exam 2: Analytics on Spreadsheets52 Questions
Exam 3: Visualizing and Exploring Data50 Questions
Exam 4: Descriptive Statistical Measures79 Questions
Exam 5: Probability Distributions and Data Modeling50 Questions
Exam 6: Sampling and Estimation59 Questions
Exam 7: Statistical Inference50 Questions
Exam 8: Predictive Modeling and Analysis64 Questions
Exam 9: Regression Analysis50 Questions
Exam 10: Forecasting Techniques55 Questions
Exam 11: Simulation and Risk Analysis50 Questions
Exam 12: Introduction to Data Mining53 Questions
Exam 13: Linear Optimization50 Questions
Exam 14: Applications of Linear Optimization62 Questions
Exam 15: Integer Optimization50 Questions
Exam 16: Nonlinear and Non-Smooth Optimization66 Questions
Exam 17: Optimization Models with Uncertainty50 Questions
Exam 18: Decision Analysis50 Questions
Select questions type
Use the data given below to answer the following question(s).
Following is an extract from the Employee Payroll Database of HFR Informatics Inc.
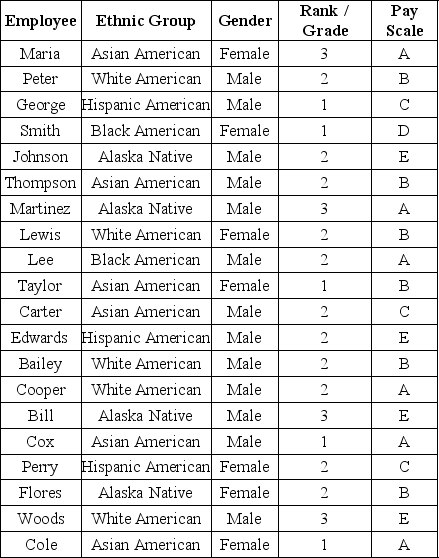 -A graphical depiction of a frequency distribution for numerical data in the form of a column chart is called a ________.
(Multiple Choice)
4.9/5  (42)
(42)
Use the data given below to answer the following question(s).
Following is an extract from the Cost per Order Database of Grogtes LLC.
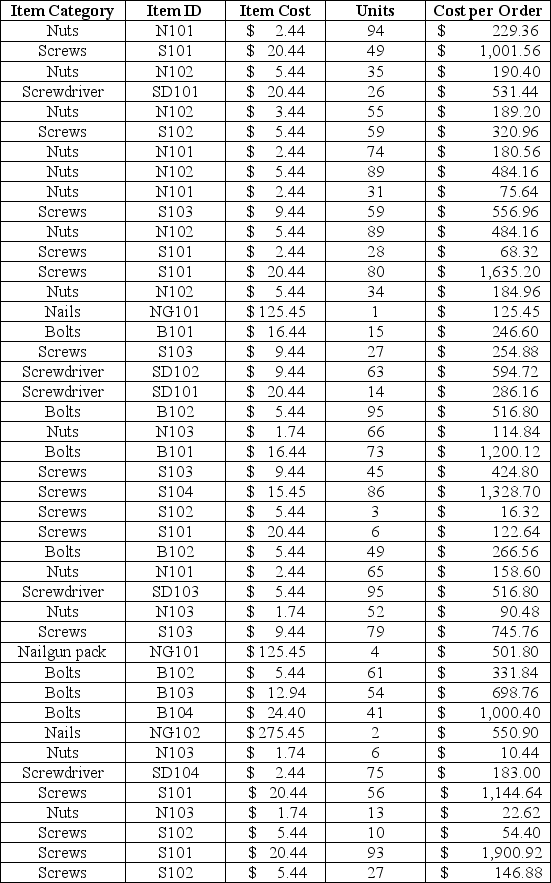 -Which of the following is true about quartiles?
(Multiple Choice)
4.8/5 (31)
Which of the following relies on sorting data and calculating the cumulative percentage of the characteristic of interest?
(Multiple Choice)
4.8/5 (34)
Use the data given below to answer the following question(s).
Following is the Sales database of Pointler's Inc., a manufacturer of clothing material.
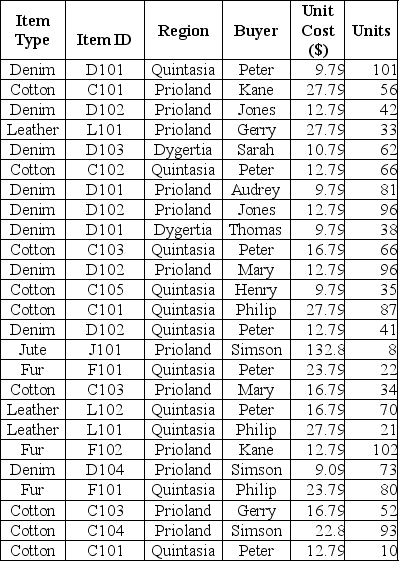 -If a data set has 'c' number of observations, the relative frequency of category 'l' is computed as ________.
(Multiple Choice)
4.8/5 (31)
To select a chart type in Excel from the Charts group, which tab has to be accessed?
(Multiple Choice)
4.9/5 (28)
Use the data given below to answer the following question(s).
Following is an extract from the Employee Payroll Database of HFR Informatics Inc.
-What is the cumulative relative frequency of employees on a 'A to D' pay scale?
(Multiple Choice)
4.9/5 (31)
Use the data given below to answer the following question(s).
Following is the purchase order database of 'The Chef Says So', a restaurant in New York, over the last quarter (April-June).
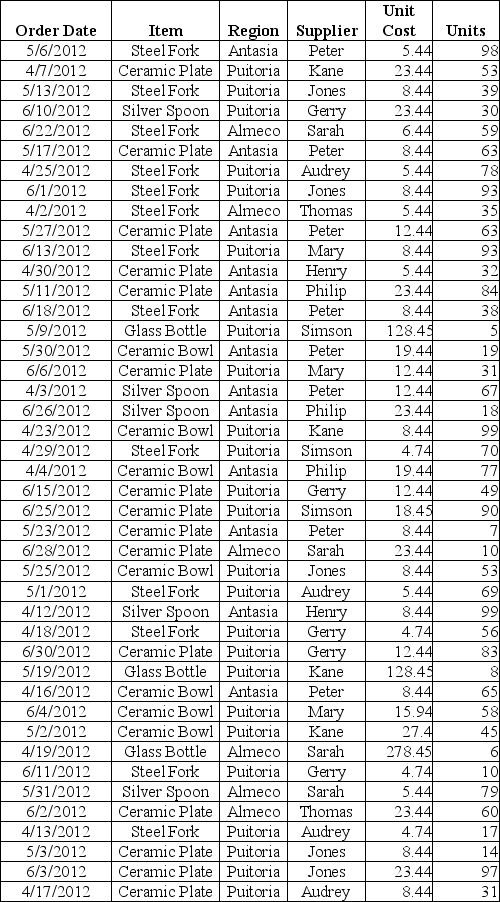 -Construct a PivotChart to visualize the purchase order total units for steel forks and ceramic bowls within each region.
(Essay)
4.8/5 (28)
Use the data given below to answer the following question(s).
Following is the purchase order database of 'The Chef Says So', a restaurant in New York, over the last quarter (April-June).
-Describe how to sort the data by inventory value to compute cumulative percentage of total inventory value to help the restaurateur conduct a Pareto analysis.(Assume that no damages were caused to the inventory purchased over the three months)
(Essay)
4.9/5 (31)
Use the data given below to answer the following question(s).
Following is the purchase order database of 'The Chef Says So', a restaurant in New York, over the last quarter (April-June).
-How is a frequency distribution calculated for categorical and numerical data?
(Essay)
4.9/5 (39)
Use the data given below to answer the following question(s).
Following is an extract from the Employee Payroll Database of HFR Informatics Inc.
-The Excel 2010 function ________ computes the kᵗʰ percentile of data in the range specified in the array field, where k is in the range 0 to 1, inclusive.
(Multiple Choice)
4.7/5 (31)
Filters
- Essay(0)
- Multiple Choice(0)
- Short Answer(0)
- True False(0)
- Matching(0)