Exam 3: Visualizing and Exploring Data
Exam 1: Introduction to Business Analytics50 Questions
Exam 2: Analytics on Spreadsheets52 Questions
Exam 3: Visualizing and Exploring Data50 Questions
Exam 4: Descriptive Statistical Measures79 Questions
Exam 5: Probability Distributions and Data Modeling50 Questions
Exam 6: Sampling and Estimation59 Questions
Exam 7: Statistical Inference50 Questions
Exam 8: Predictive Modeling and Analysis64 Questions
Exam 9: Regression Analysis50 Questions
Exam 10: Forecasting Techniques55 Questions
Exam 11: Simulation and Risk Analysis50 Questions
Exam 12: Introduction to Data Mining53 Questions
Exam 13: Linear Optimization50 Questions
Exam 14: Applications of Linear Optimization62 Questions
Exam 15: Integer Optimization50 Questions
Exam 16: Nonlinear and Non-Smooth Optimization66 Questions
Exam 17: Optimization Models with Uncertainty50 Questions
Exam 18: Decision Analysis50 Questions
Select questions type
Use the data given below to answer the following question(s).
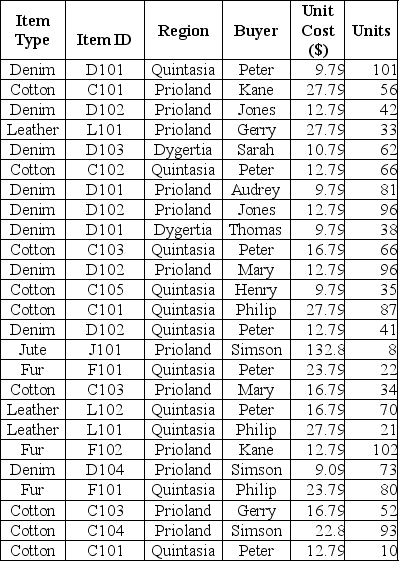
Following is the Sales database of Pointler's Inc., a manufacturer of clothing material.
 -To construct a frequency distribution for categorical data, the
(Multiple Choice)
4.9/5  (36)
(36)
Use the data given below to answer the following question(s).
Following is an extract from the Cost per Order Database of Grogtes LLC.
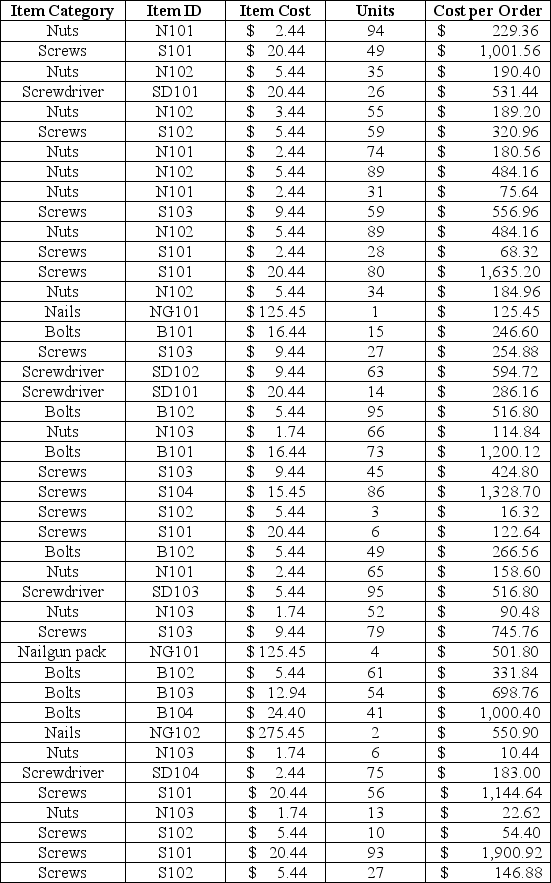 -Which of the following observations is closest to the 87th percentile of costs per order?
(Multiple Choice)
4.9/5 (33)
Use the data given below to answer the following question(s).
Following is the Sales database of Pointler's Inc., a manufacturer of clothing material.
-Use Excel to identify the buyer who made the highest single purchase of cotton (in terms of sales revenue for Pointler's Inc.)in Quintasia.
(Multiple Choice)
4.7/5 (39)
Use the data given below to answer the following question(s).
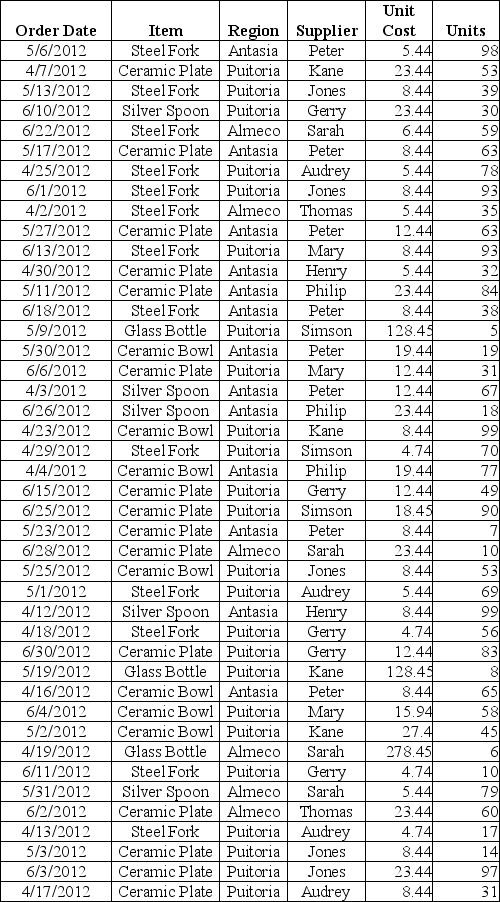
Following is the purchase order database of 'The Chef Says So', a restaurant in New York, over the last quarter (April-June).
 -Elaborate on the use of geographic data mapping in business analytics.
(Essay)
4.7/5 (30)
Use the data given below to answer the following question(s).
Following is the purchase order database of 'The Chef Says So', a restaurant in New York, over the last quarter (April-June).
-Describe how to and construct a line chart exhibiting the purchase order of ceramic plates over the three months.
(Essay)
4.9/5 (39)
Use the data given below to answer the following question(s).
Following is an extract from the Employee Payroll Database of HFR Informatics Inc.
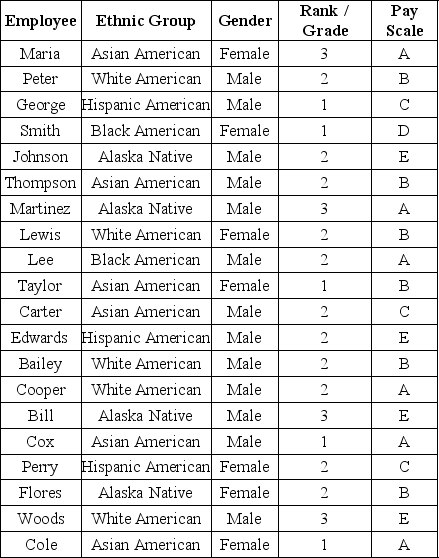 -What is the relative frequency of Grade 3 employees?
(Multiple Choice)
4.8/5 (32)
Use the data given below to answer the following question(s).
Following is an extract from the Employee Payroll Database of HFR Informatics Inc.
-What is the relative frequency of Female employees?
(Multiple Choice)
5.0/5 (37)
Use the data given below to answer the following question(s).
Following is the purchase order database of 'The Chef Says So', a restaurant in New York, over the last quarter (April-June).
-Construct a relative frequency distribution for items in the purchase order database and show the proportions of the frequencies visually using a pie chart.
(Essay)
4.8/5 (31)
Observations consisting of pairs of variable data are required to construct a ________ chart.
(Multiple Choice)
4.8/5 (35)
Use the data given below to answer the following question(s).
Following is an extract from the Cost per Order Database of Grogtes LLC.
-Which of the following is true about cross-tabulation?
(Multiple Choice)
4.7/5 (45)
Use the data given below to answer the following question(s).
Following is the Sales database of Pointler's Inc., a manufacturer of clothing material.
-Use Excel to calculate the total $ amount of sales made to Quintasia.Include the sale of fur, jute, and leather.
(Multiple Choice)
4.9/5 (30)
Use the data given below to answer the following question(s).
Following is an extract from the Cost per Order Database of Grogtes LLC.
-After choosing the PivotTable, the PivotChart can be found on the ________ tab.
(Multiple Choice)
4.9/5 (28)
Use the data given below to answer the following question(s).
Following is the purchase order database of 'The Chef Says So', a restaurant in New York, over the last quarter (April-June).
-Fewer groups provide a "coarse" histogram.
(True/False)
4.7/5 (32)
Roger wants to compare values across categories using vertical rectangles.Which of the following charts must Roger use?
(Multiple Choice)
4.8/5 (32)
Which of the following charts shows three-dimensional data?
(Multiple Choice)
4.8/5 (31)
Use the data given below to answer the following question(s).
Following is an extract from the Cost per Order Database of Grogtes LLC.
-Which of the following does the second quartile of the costs per order indicate?
(Multiple Choice)
4.8/5 (34)
Use the data given below to answer the following question(s).
Following is the purchase order database of 'The Chef Says So', a restaurant in New York, over the last quarter (April-June).
-Describe and construct a cross-tabulation showing the region-wise percentage breakdown of purchase of glass bottles and silver spoons and visually represent the data in a 3-D cylindrical chart.
Counts:
Region Glass Bottle Silver Spoon Grand Total Almeco 6 79 85 Antasia 0 184 184 Puitoria 13 30 43
Percentages by Region:
Region Glass Bottle Silver Spoon Grand Total Almeco 7\% 93\% 100\% Antasia 0\% 100\% 100\% Puitoria 30\% 70\% 100\%
(Essay)
4.8/5 (37)
Which of the following charts allows plotting of multiple dimensions of several data series?
(Multiple Choice)
4.8/5 (25)
Use the data given below to answer the following question(s).
Following is the purchase order database of 'The Chef Says So', a restaurant in New York, over the last quarter (April-June).
-Explain with an example the filtering tool provided by Excel for simple criteria.
(Essay)
4.9/5 (30)
Use the data given below to answer the following question(s).
Following is the purchase order database of 'The Chef Says So', a restaurant in New York, over the last quarter (April-June).
-How does Excel distinguish between vertical and horizontal bar charts?
(Essay)
4.8/5 (43)
Filters
- Essay(0)
- Multiple Choice(0)
- Short Answer(0)
- True False(0)
- Matching(0)