Exam 4: Descriptive Statistical Measures
Exam 1: Introduction to Business Analytics50 Questions
Exam 2: Analytics on Spreadsheets52 Questions
Exam 3: Visualizing and Exploring Data50 Questions
Exam 4: Descriptive Statistical Measures79 Questions
Exam 5: Probability Distributions and Data Modeling50 Questions
Exam 6: Sampling and Estimation59 Questions
Exam 7: Statistical Inference50 Questions
Exam 8: Predictive Modeling and Analysis64 Questions
Exam 9: Regression Analysis50 Questions
Exam 10: Forecasting Techniques55 Questions
Exam 11: Simulation and Risk Analysis50 Questions
Exam 12: Introduction to Data Mining53 Questions
Exam 13: Linear Optimization50 Questions
Exam 14: Applications of Linear Optimization62 Questions
Exam 15: Integer Optimization50 Questions
Exam 16: Nonlinear and Non-Smooth Optimization66 Questions
Exam 17: Optimization Models with Uncertainty50 Questions
Exam 18: Decision Analysis50 Questions
Select questions type
Which of the following is the equation for calculating the coefficient of variation (CV)?
(Multiple Choice)
5.0/5  (35)
(35)
Use the table below to answer the following question(s).
Below is a table showing the costs per order of items bought by a computer hardware store.
Supplier Item Description Cost per Order Aloham Technologies Monitors \ 250 Aloham Technologies Hard Disks \ 220 Aloham Technologies Power Supply \ 88 Aloham Technologies Graphics Card \ 300 Aloham Technologies Processor \ 325 Aloham Technologies Speakers \ 88 MindRoot Hardwares Flashdrive \ 9 MindRoot Hardwares Graphics Card \ 299 MindRoot Hardwares CD-ROM \ 88 MindRoot Hardwares Bluetooth Device \ 80
-Calculate the mean cost per order.
(Multiple Choice)
4.7/5 (37)
In the z-score formula, which of the following is true if the value in the numerator is a negative value?
(Multiple Choice)
4.8/5 (39)
The difference between the first and third quartiles is referred to as the ________.
(Multiple Choice)
4.8/5 (34)
Which of the following formula is used to compute covariance between two variables X and Y?
(Multiple Choice)
4.9/5 (38)
Use the spreadsheet below to answer the following question(s).
Below is the table showing rate of shoes sold per day and the highest-priced shoe sold that day for a one-week period.The rate of shoes sold per day (X)and the price of the shoes (Y).
Shoes sold in \% () Price (Y) 15 \ 48 27 \ 55 10 \ 40 13 \ 88 25 \ 53 9 \ 47 18 \ 40
-Use Excel to calculate the coefficient of variation of X.
(Multiple Choice)
4.7/5 (38)
The table below shows the sales per day at a grocery store over a period of a week.Calculate the z-score for sales on Day 4.
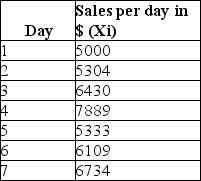
(Essay)
4.8/5 (31)
According to the interquartile range, extreme outliers are more than 3*IQR away from the left of Q1 or to the right of Q3.
(True/False)
4.8/5 (33)
________ is a measure of the linear relationship between two variables, X and Y, which does not depend on the units of measurement.
(Multiple Choice)
4.7/5 (42)
The larger the variance, the more the data are spread out from the mean.
(True/False)
4.9/5 (43)
In statistical notation, the elements of a data set are typically labeled as ________.
(Multiple Choice)
4.9/5 (30)
What is statistical thinking? How is it important to making business decisions?
(Essay)
4.8/5 (30)
In finance, the ________ is the ratio of a fund's excess returns (annualized total returns minus Treasury bill returns)to its standard deviation.
(Multiple Choice)
4.7/5 (28)
Filters
- Essay(0)
- Multiple Choice(0)
- Short Answer(0)
- True False(0)
- Matching(0)