Exam 11: Simulation and Risk Analysis
Exam 1: Introduction to Business Analytics50 Questions
Exam 2: Analytics on Spreadsheets52 Questions
Exam 3: Visualizing and Exploring Data50 Questions
Exam 4: Descriptive Statistical Measures79 Questions
Exam 5: Probability Distributions and Data Modeling50 Questions
Exam 6: Sampling and Estimation59 Questions
Exam 7: Statistical Inference50 Questions
Exam 8: Predictive Modeling and Analysis64 Questions
Exam 9: Regression Analysis50 Questions
Exam 10: Forecasting Techniques55 Questions
Exam 11: Simulation and Risk Analysis50 Questions
Exam 12: Introduction to Data Mining53 Questions
Exam 13: Linear Optimization50 Questions
Exam 14: Applications of Linear Optimization62 Questions
Exam 15: Integer Optimization50 Questions
Exam 16: Nonlinear and Non-Smooth Optimization66 Questions
Exam 17: Optimization Models with Uncertainty50 Questions
Exam 18: Decision Analysis50 Questions
Select questions type
What are three types of Risk Solver Platform charts used to obtain multiple simulation results?
(Essay)
4.9/5  (27)
(27)
Monte Carlo sampling differs from Latin Hypercube sampling in that the Monte Carlo sampling ________.
(Multiple Choice)
4.9/5 (35)
Use the information below to answer the following question(s).
Below is a spreadsheet for Trance Electronics.
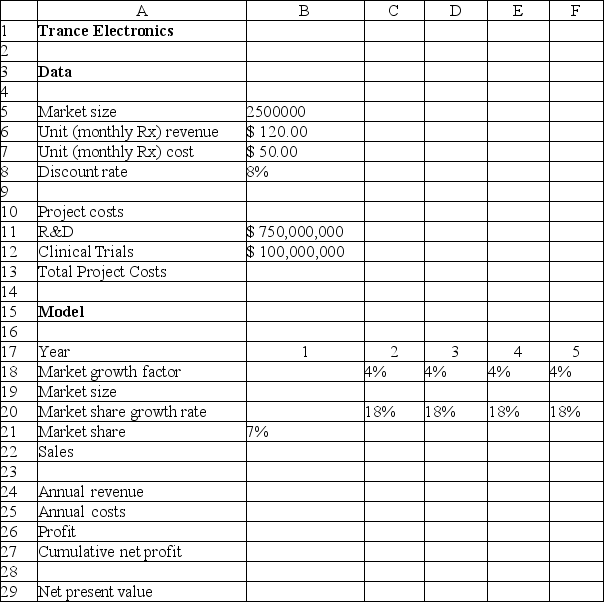 Suppose that the project manager of Trance Electronics has identified the following uncertain variables in the model and the distributions and parameters that describe them, as follows:
 : normal with mean of 2,000,000 units and standard deviation of 400,000 units.
 : uniform between $600,000,000 and $800,000,000.
 : lognormal with mean of $150,000,000 and standard deviation $30,000,000.
 : triangular with minimum = 2%, maximum = 6%, and most likely = 3%.
 : triangular with minimum = 15%, maximum = 25%, and most likely = 20%.
The number of trials per simulation is equal to 10,000 at a Sim.Random Seed of 2.Run the simulation and answer the following questions using the Risk Solver Platform.
-What is the correlation of the R&D cost with the NPV with reference to the sensitivity chart?
: triangular with minimum = 15%, maximum = 25%, and most likely = 20%.
The number of trials per simulation is equal to 10,000 at a Sim.Random Seed of 2.Run the simulation and answer the following questions using the Risk Solver Platform.
-What is the correlation of the R&D cost with the NPV with reference to the sensitivity chart?
(Multiple Choice)
4.8/5 (28)
Answer the following question(s)using the Risk Solver Platform (5000 trials per simulation).
Consider the spreadsheet for a Newsvendor Model.
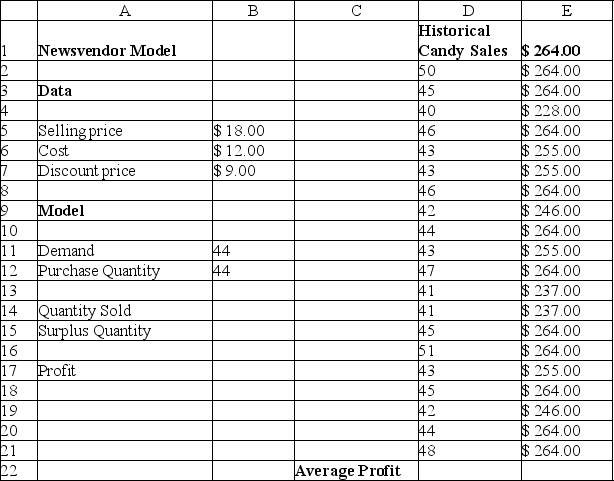 -What is the value of mean profit?
(Multiple Choice)
4.9/5 (31)
How does the Risk Solver Platform define an uncertain function cell?
(Multiple Choice)
4.8/5 (41)
As Monte Carlo simulation is essentially statistical sampling, the larger the number of trials used, the more precise is the result.
(True/False)
4.8/5 (32)
Use the information below to answer the following question(s).
Below is a spreadsheet for Trance Electronics.
Suppose that the project manager of Trance Electronics has identified the following uncertain variables in the model and the distributions and parameters that describe them, as follows:
: normal with mean of 2,000,000 units and standard deviation of 400,000 units.
: uniform between $600,000,000 and $800,000,000.
: lognormal with mean of $150,000,000 and standard deviation $30,000,000.
: triangular with minimum = 2%, maximum = 6%, and most likely = 3%.
: triangular with minimum = 15%, maximum = 25%, and most likely = 20%.
The number of trials per simulation is equal to 10,000 at a Sim.Random Seed of 2.Run the simulation and answer the following questions using the Risk Solver Platform.
-What are the chances that the product will show a cumulative net profit in the fourth year?
(Multiple Choice)
4.7/5 (31)
If a simulation has multiple output variables that are related to one another, the distributions of all output variables can be viewed on a single Risk Solver Platform chart called a(n)________.
(Multiple Choice)
4.9/5 (30)
Use the information below to answer the following question(s).
Consider the following spreadsheet for an outsourcing decision model.
1 \ A B 2 Outsourcing Decision Model 3 Data 4 5 Manufactured in-house 6 Fixed cost \ 60,000 7 Unit variable cost \ 130 8 9 Purchased from supplier 10 Unit cost \ 180 11 12 Demand volume \ 1,600 13 14 Model 15 16 Total manufacturing cost 17 Total purchased cost 18 19 Difference 20 Decision
We assume that the production (demand)volume is normally distributed with a mean of 1,000 and a standard deviation of 100.For the unit cost, select the triangular distribution.It has a minimum value of $150, most likely value of $165, and a maximum value of $190.The number of trials per simulation is equal to 5,000 at a Sim.Random Seed of 1.Run the simulation and answer the following question(s)using the Risk Solver Platform.
-What is the value of mode obtained from the simulation results?
(Multiple Choice)
4.9/5 (33)
Latin Hypercube sampling differs from Monte Carlo sampling in that the Latin Hypercube sampling ________.
(Multiple Choice)
4.8/5 (31)
Filters
- Essay(0)
- Multiple Choice(0)
- Short Answer(0)
- True False(0)
- Matching(0)