Exam 14: Statistical Applications in Quality Management
Exam 1: Introduction118 Questions
Exam 2: Organizing and Visualizing Data210 Questions
Exam 3: Numerical Descriptive Measures143 Questions
Exam 4: Basic Probability171 Questions
Exam 5: Discrete Probability Distributions137 Questions
Exam 6: The Normal Distribution145 Questions
Exam 7: Sampling and Sampling Distributions197 Questions
Exam 8: Confidence Interval Estimation185 Questions
Exam 9: Fundamentals of Hypothesis Testing: One-Sample Tests168 Questions
Exam 10: Two-Sample Tests and One-Way ANOVA293 Questions
Exam 11: Chi-Square Tests108 Questions
Exam 12: Simple Linear Regression213 Questions
Exam 13: Introduction to Multiple Regression291 Questions
Exam 14: Statistical Applications in Quality Management107 Questions
Select questions type
TABLE 14-6
The maker of a packaged candy wants to evaluate the quality of her production process. On each of 16 consecutive days, she samples 600 bags of candy and determines the number in each day's sample that she considers to be of poor quality. The data that she developed follow. 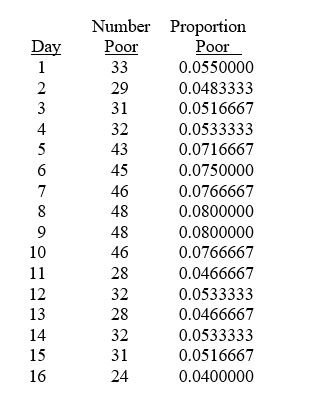 -Referring to Table 14-6, the estimate of the proportion of poor quality bags of candy is ________.
(Short Answer)
5.0/5  (34)
(34)
TABLE 14-4
A factory supervisor is concerned that the time it takes workers to complete an important production task (measured in seconds) is too erratic and adversely affects expected profits. The supervisor proceeds by randomly sampling 5 individuals per hour for a period of 10 hours. The sample mean and range for each hour are listed below.
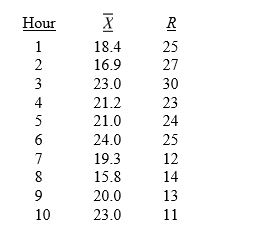 She also decides that lower and upper specification limit for the critical-to-quality variable should be 10 and 30 seconds, respectively.
-It is not possible for the
She also decides that lower and upper specification limit for the critical-to-quality variable should be 10 and 30 seconds, respectively.
-It is not possible for the  chart to be out of control when the R chart is in control.
(True/False)
4.8/5 (43)
TABLE 14-4
A factory supervisor is concerned that the time it takes workers to complete an important production task (measured in seconds) is too erratic and adversely affects expected profits. The supervisor proceeds by randomly sampling 5 individuals per hour for a period of 10 hours. The sample mean and range for each hour are listed below.
She also decides that lower and upper specification limit for the critical-to-quality variable should be 10 and 30 seconds, respectively.
-The cause of variation that can be reduced only by changing the system is ________ cause variation.
(Short Answer)
4.8/5 (31)
TABLE 14-4
A factory supervisor is concerned that the time it takes workers to complete an important production task (measured in seconds) is too erratic and adversely affects expected profits. The supervisor proceeds by randomly sampling 5 individuals per hour for a period of 10 hours. The sample mean and range for each hour are listed below.
She also decides that lower and upper specification limit for the critical-to-quality variable should be 10 and 30 seconds, respectively.
-In the United States, the control limits on a control chart are placed so that they are 3 standard deviations above and below a central line.
(True/False)
4.8/5 (42)
TABLE 14-5
A manufacturer of computer disks took samples of 240 disks on 15 consecutive days. The number of disks with bad sectors was determined for each of these samples. The results are in the table that follows. 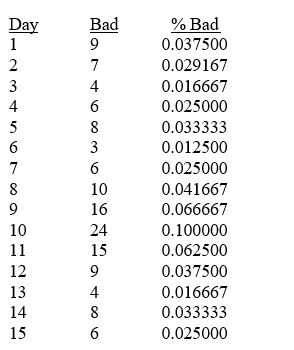 -Referring to Table 14-5, a p control chart is to be made for these data. The estimate of the standard error of the proportion of disks with bad sectors is ________.
(Short Answer)
4.9/5 (30)
TABLE 14-7
A supplier of silicone sheets for producers of computer chips wants to evaluate her manufacturing process. She takes samples of size 5 from each day's output and counts the number of blemishes on each silicone sheet. The results from 20 days of such evaluations are presented below.
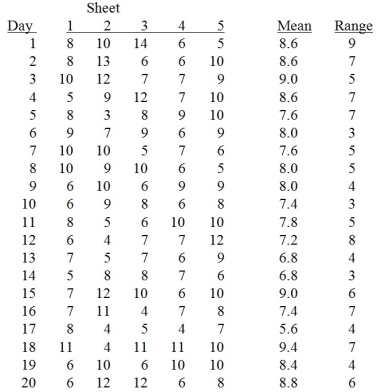 She also decides that the upper specification limit is 10 blemishes.
-Referring to Table 14-7, an R chart is to be constructed for the number of blemishes. One way to create the lower control limit involves multiplying the mean of the sample ranges by D₃. For this data set, the value of D₃ is ________.
She also decides that the upper specification limit is 10 blemishes.
-Referring to Table 14-7, an R chart is to be constructed for the number of blemishes. One way to create the lower control limit involves multiplying the mean of the sample ranges by D₃. For this data set, the value of D₃ is ________.
(Short Answer)
4.9/5 (42)
Variation signaled by individual fluctuations or patterns in the data is called
(Multiple Choice)
4.9/5 (41)
Which of the following situations suggests a process that appears to be operating in a state of statistical control?
(Multiple Choice)
4.8/5 (37)
TABLE 14-9
The manufacturer of canned food constructed control charts and analyzed several quality characteristics. One characteristic of interest is the weight of the filled cans. The lower specification limit for weight is 2.95 pounds. The table below provides the range and mean of the weights of five cans tested every fifteen minutes during a day's production.
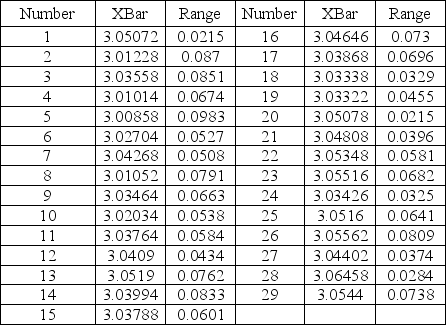 -Referring to Table 14-9, an R chart is to be constructed for the weight. One way to create the upper control limit involves multiplying the mean of the sample ranges by D₄. For this data set, the value of D₄ is ________.
(Short Answer)
4.8/5 (37)
TABLE 14-9
The manufacturer of canned food constructed control charts and analyzed several quality characteristics. One characteristic of interest is the weight of the filled cans. The lower specification limit for weight is 2.95 pounds. The table below provides the range and mean of the weights of five cans tested every fifteen minutes during a day's production.
-Which of the following is NOT part of the Shewhart-Deming cycle?
(Multiple Choice)
4.7/5 (38)
TABLE 14-4
A factory supervisor is concerned that the time it takes workers to complete an important production task (measured in seconds) is too erratic and adversely affects expected profits. The supervisor proceeds by randomly sampling 5 individuals per hour for a period of 10 hours. The sample mean and range for each hour are listed below.
She also decides that lower and upper specification limit for the critical-to-quality variable should be 10 and 30 seconds, respectively.
-Referring to Table 14-4, suppose the supervisor constructs an  chart to see if the process is in control. What are the lower and upper control limits of this chart?
(Multiple Choice)
4.8/5 (35)
TABLE 14-9
The manufacturer of canned food constructed control charts and analyzed several quality characteristics. One characteristic of interest is the weight of the filled cans. The lower specification limit for weight is 2.95 pounds. The table below provides the range and mean of the weights of five cans tested every fifteen minutes during a day's production.
-Which of the following is NOT one of Deming's 14 points?
(Multiple Choice)
4.8/5 (40)
Which of the following situations suggests a process that appears to be operating out of statistical control?
(Multiple Choice)
4.9/5 (25)
TABLE 14-6
The maker of a packaged candy wants to evaluate the quality of her production process. On each of 16 consecutive days, she samples 600 bags of candy and determines the number in each day's sample that she considers to be of poor quality. The data that she developed follow.
-Referring to Table 14-6, construct a p control chart for these data.
(Essay)
4.8/5 (38)
TABLE 14-9
The manufacturer of canned food constructed control charts and analyzed several quality characteristics. One characteristic of interest is the weight of the filled cans. The lower specification limit for weight is 2.95 pounds. The table below provides the range and mean of the weights of five cans tested every fifteen minutes during a day's production.
-Referring to Table 14-9, construct an  chart for the weight.
(Essay)
4.9/5 (42)
TABLE 14-4
A factory supervisor is concerned that the time it takes workers to complete an important production task (measured in seconds) is too erratic and adversely affects expected profits. The supervisor proceeds by randomly sampling 5 individuals per hour for a period of 10 hours. The sample mean and range for each hour are listed below.
She also decides that lower and upper specification limit for the critical-to-quality variable should be 10 and 30 seconds, respectively.
-Referring to Table 14-4, suppose the supervisor constructs an  chart to see if the process is in control. Which expression best describes this chart?
(Multiple Choice)
4.8/5 (40)
TABLE 14-6
The maker of a packaged candy wants to evaluate the quality of her production process. On each of 16 consecutive days, she samples 600 bags of candy and determines the number in each day's sample that she considers to be of poor quality. The data that she developed follow.
-Referring to Table 14-6, a p control chart is to be constructed for these data. The center line for the chart should be located at ________.
(Short Answer)
4.9/5 (32)
The principal focus of the control chart is the attempt to separate special or assignable causes of variation from common causes of variation. Which causes of variation can be reduced only by changing the system?
(Multiple Choice)
4.8/5 (38)
TABLE 14-4
A factory supervisor is concerned that the time it takes workers to complete an important production task (measured in seconds) is too erratic and adversely affects expected profits. The supervisor proceeds by randomly sampling 5 individuals per hour for a period of 10 hours. The sample mean and range for each hour are listed below.
She also decides that lower and upper specification limit for the critical-to-quality variable should be 10 and 30 seconds, respectively.
-One of the morals of the red bead experiment is that variation is part of any process.
(True/False)
4.9/5 (31)
Filters
- Essay(0)
- Multiple Choice(0)
- Short Answer(0)
- True False(0)
- Matching(0)