Exam 10: Basic Macroeconomic Relationships
Exam 2: The Market System and the Circular Flow274 Questions
Exam 3: Demand, Supply, and Market Equilibrium357 Questions
Exam 4: Market Failures Caused by Externalities Asymmetric Information222 Questions
Exam 5: Public Goods, Public Choice, and Government Failure242 Questions
Exam 6: An Introduction to Macroeconomics243 Questions
Exam 7: Measuring Domestic Output and National Income238 Questions
Exam 8: Economic Growth274 Questions
Exam 9: Business Cycles, Unemployment, and Inflation298 Questions
Exam 10: Basic Macroeconomic Relationships233 Questions
Exam 11: The Aggregate Expenditures Model126 Questions
Exam 12: Aggregate Demand and Aggregate Supply320 Questions
Exam 13: Fiscal Policy, Deficits, and Debt401 Questions
Exam 14: Money, Banking, and Financial Institutions265 Questions
Exam 15: Money Creation285 Questions
Exam 16: Interest Rates and Monetary Policy405 Questions
Exam 17: Financial Economics356 Questions
Exam 18: Extending the Analysis of Aggregate Supply268 Questions
Exam 19: Current Issues in Macro Theory and Policy279 Questions
Exam 20: International Trade339 Questions
Exam 21: The Balance of Payments, Exchange Rates, and Trade Deficits315 Questions
Exam 22: The Economics of Developing Countries269 Questions
Select questions type
If the consumption schedule is a straight line, it can be concluded that the
(Multiple Choice)
4.7/5  (37)
(37)
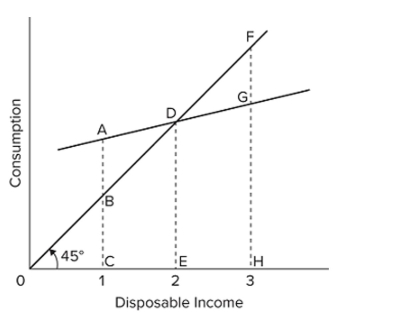 Refer to the consumption schedule shown in the graph. At income level 1, the amount of saving is
(Multiple Choice)
4.9/5 (45)
If a $50 billion decrease in investment spending causes income to decline by $50 billion in the first round of the multiplier process and by $25 in the second round, the multiplier in the economy is
(Multiple Choice)
4.8/5 (42)
The investment demand curve portrays an inverse (negative) relationship between
(Multiple Choice)
4.7/5 (33)
If consumption increases while income remains the same, the average propensity to consume will
(Multiple Choice)
4.8/5 (43)
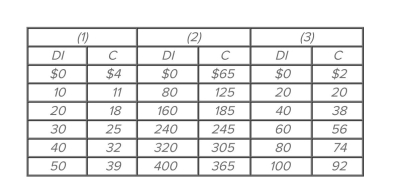 Refer to the given consumption schedules. DI signifies disposable income and C represents consumption expenditures. All figures are in billions of dollars. The marginal propensity to consume in
Economy (1) is
Refer to the given consumption schedules. DI signifies disposable income and C represents consumption expenditures. All figures are in billions of dollars. The marginal propensity to consume in
Economy (1) is
(Multiple Choice)
4.7/5 (33)
Disposable Income Consumption \ 300 \ 310 350 340 400 370 450 400 500 430 The table shows a consumption schedule. The marginal propensity to consume is
(Multiple Choice)
4.9/5 (36)
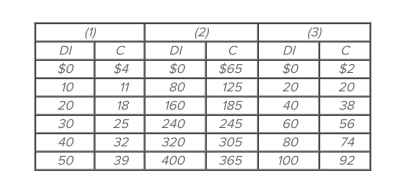 Refer to the given consumption schedules. DI signifies disposable income and C represents consumption expenditures. All figures are in billions of dollars. The marginal propensity to save
(Multiple Choice)
4.9/5 (37)
If a $100 billion decrease in investment spending causes income to decline by $100 billion in the first round of the multiplier process and by $75 billion in the second round, income will eventually decline
By
(Multiple Choice)
4.7/5 (30)
What is the slope of the consumption schedule or consumption line for a given economy?
(Multiple Choice)
4.9/5 (42)
The investment demand curve will shift to the right as a result of
(Multiple Choice)
4.8/5 (43)
(Last Word) Art Buchwald's article "Squaring the Economic Circle" humorously describes how
(Multiple Choice)
4.8/5 (41)
If the real interest rate in the economy is i and the expected rate of return on additional investment is r, then, other things equal,
(Multiple Choice)
5.0/5 (39)
When consumption and saving are graphed relative to real GDP, an increase in personal taxes will shift
(Multiple Choice)
4.9/5 (41)
In the late 1990s, the U.S. stock market boomed, causing U.S. consumption to rise. Economists refer to this outcome as the
(Multiple Choice)
4.8/5 (39)
Filters
- Essay(0)
- Multiple Choice(0)
- Short Answer(0)
- True False(0)
- Matching(0)