Exam 10: Basic Macroeconomic Relationships
Exam 2: The Market System and the Circular Flow274 Questions
Exam 3: Demand, Supply, and Market Equilibrium357 Questions
Exam 4: Market Failures Caused by Externalities Asymmetric Information222 Questions
Exam 5: Public Goods, Public Choice, and Government Failure242 Questions
Exam 6: An Introduction to Macroeconomics243 Questions
Exam 7: Measuring Domestic Output and National Income238 Questions
Exam 8: Economic Growth274 Questions
Exam 9: Business Cycles, Unemployment, and Inflation298 Questions
Exam 10: Basic Macroeconomic Relationships233 Questions
Exam 11: The Aggregate Expenditures Model126 Questions
Exam 12: Aggregate Demand and Aggregate Supply320 Questions
Exam 13: Fiscal Policy, Deficits, and Debt401 Questions
Exam 14: Money, Banking, and Financial Institutions265 Questions
Exam 15: Money Creation285 Questions
Exam 16: Interest Rates and Monetary Policy405 Questions
Exam 17: Financial Economics356 Questions
Exam 18: Extending the Analysis of Aggregate Supply268 Questions
Exam 19: Current Issues in Macro Theory and Policy279 Questions
Exam 20: International Trade339 Questions
Exam 21: The Balance of Payments, Exchange Rates, and Trade Deficits315 Questions
Exam 22: The Economics of Developing Countries269 Questions
Select questions type
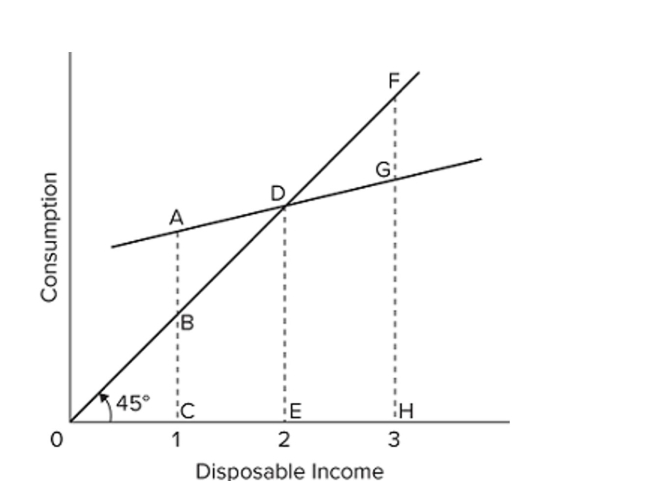 Refer to the consumption schedule shown in the graph. Disposable income equals consumption at point
(Multiple Choice)
4.9/5  (32)
(32)
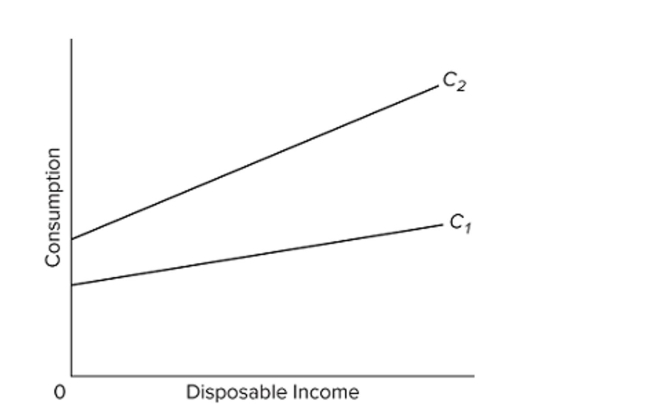 Suppose an economy's consumption schedule shifts from C1 to C2, as shown in the diagram. We can say that its
(Multiple Choice)
4.7/5 (27)
If a $200 billion increase in investment spending creates $200 billion of new income in the first round of the multiplier process and $160 billion in the second round, the multiplier in the economy is
(Multiple Choice)
4.8/5 (36)
Change in Income Change in Consumption Change in Saving Assumed Increase in Investment \ 20 \ \ 4.00 Second Round \ \ 12.80 \ All Other Rounds \ \ 51.20 \ Totals \ \ \ 20.00 Refer to the given table, which illustrates the multiplier process. The change in income in round two will be
(Multiple Choice)
4.8/5 (37)
Disposable Income Consumption \ 200 \ 205 225 225 250 245 275 265 300 285 Refer to the given data. At the $200 level of disposable income,
(Multiple Choice)
4.9/5 (41)
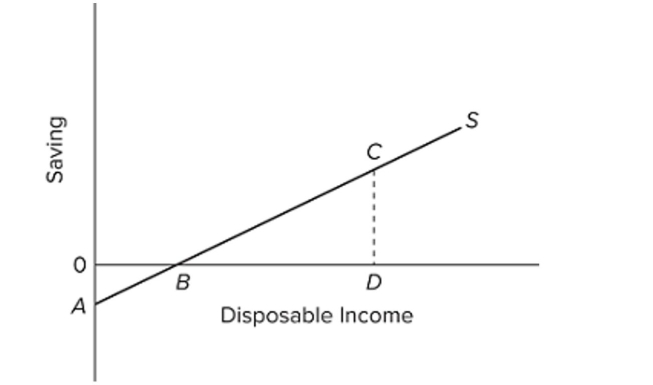 The saving schedule shown in the diagram would shift downward if, all else equal,
(Multiple Choice)
4.9/5 (42)
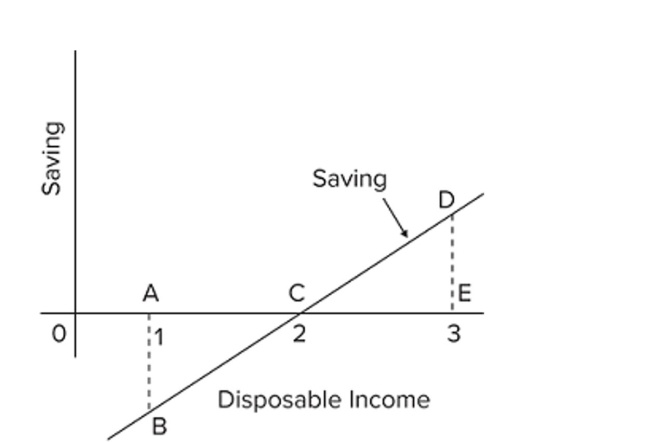 Refer to the given saving schedule. Dissaving occurs when disposable income is
(Multiple Choice)
4.9/5 (32)
One can determine the amount of any level of total income that is consumed by
(Multiple Choice)
4.8/5 (31)
If the nominal interest rate is 18 percent and the real interest rate is 6 percent, the inflation rate is
(Multiple Choice)
4.9/5 (26)
Assume there are no prospective investment projects (I) that will yield an expected rate of return (r) of 25 percent or more, but there are $5 billion of investment opportunities with an expected rate of
Return between 20 and 25 percent, an additional $5 billion between 15 and 20 percent, and so on. If
The real interest rate is 15 percent in this economy, the aggregate amount of investment will be
(Multiple Choice)
4.8/5 (28)
Disposable Income Consumption \ 0 \ 8 80 80 160 152 240 224 320 296 400 368 The disposable income (DI) and consumption (C) schedules are for a private, closed economy. All ?gures are in billions of dollars. If plotted on a graph, the slope of the consumption schedule would be
(Multiple Choice)
4.9/5 (38)
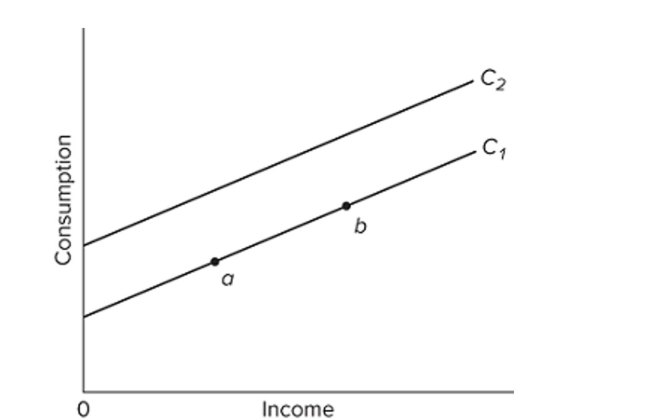 Refer to the given graph. A movement from a to b along C1 might be caused by a(n)
(Multiple Choice)
4.9/5 (40)
Disposable Income Consumption (C) \ 0 \ 40 100 100 200 160 300 220 400 280 (Advanced analysis) Which of the following equations correctly represents the given data?
(Multiple Choice)
4.8/5 (42)
If disposable income is $900 billion when the average propensity to consume is 0.9, it can be concluded that
(Multiple Choice)
4.8/5 (38)
Filters
- Essay(0)
- Multiple Choice(0)
- Short Answer(0)
- True False(0)
- Matching(0)