Exam 10: Basic Macroeconomic Relationships
Exam 2: The Market System and the Circular Flow274 Questions
Exam 3: Demand, Supply, and Market Equilibrium357 Questions
Exam 4: Market Failures Caused by Externalities Asymmetric Information222 Questions
Exam 5: Public Goods, Public Choice, and Government Failure242 Questions
Exam 6: An Introduction to Macroeconomics243 Questions
Exam 7: Measuring Domestic Output and National Income238 Questions
Exam 8: Economic Growth274 Questions
Exam 9: Business Cycles, Unemployment, and Inflation298 Questions
Exam 10: Basic Macroeconomic Relationships233 Questions
Exam 11: The Aggregate Expenditures Model126 Questions
Exam 12: Aggregate Demand and Aggregate Supply320 Questions
Exam 13: Fiscal Policy, Deficits, and Debt401 Questions
Exam 14: Money, Banking, and Financial Institutions265 Questions
Exam 15: Money Creation285 Questions
Exam 16: Interest Rates and Monetary Policy405 Questions
Exam 17: Financial Economics356 Questions
Exam 18: Extending the Analysis of Aggregate Supply268 Questions
Exam 19: Current Issues in Macro Theory and Policy279 Questions
Exam 20: International Trade339 Questions
Exam 21: The Balance of Payments, Exchange Rates, and Trade Deficits315 Questions
Exam 22: The Economics of Developing Countries269 Questions
Select questions type
If households consume less at each level of disposable income, they are
(Multiple Choice)
4.8/5  (39)
(39)
Suppose a family's consumption exceeds its disposable income. This means that its
(Multiple Choice)
4.9/5 (37)
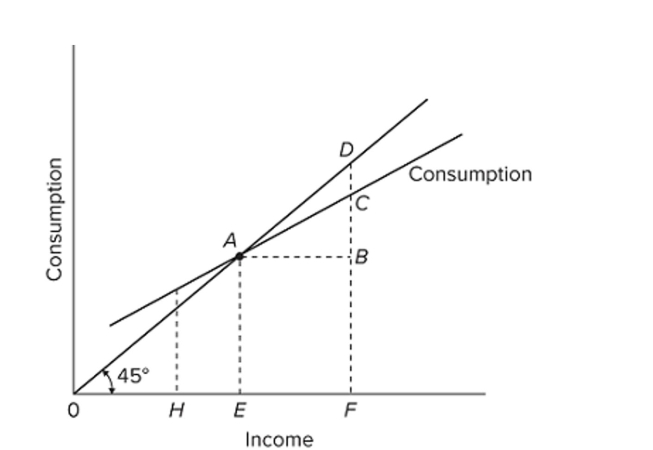 Refer to the given diagram. The marginal propensity to consume is equal to
(Multiple Choice)
4.9/5 (40)
Disposable Income Consumption \ 300 \ 310 350 340 400 370 450 400 500 430 The table shows a consumption schedule. At the $300 level of disposable income,
(Multiple Choice)
4.8/5 (41)
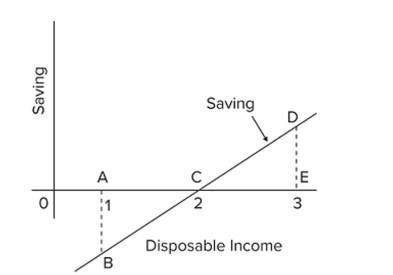 Refer to the given saving schedule. As income falls from level 3 to level 2, the amount of
(Multiple Choice)
4.9/5 (33)
Disposable Income Consumption \ 200 \ 205 225 225 250 245 275 265 300 285 Refer to the given data. If disposable income was $325, we would expect consumption to be
(Multiple Choice)
4.7/5 (39)
Assume a machine that has a useful life of only one year costs $2,000. Assume, also, that net of such operating costs as power, taxes, and so forth, the additional revenue from the output of this machine is
Expected to be $2,300. If the firm finds it can borrow funds at an interest rate of 10 percent, the firm
Should
(Multiple Choice)
4.8/5 (36)
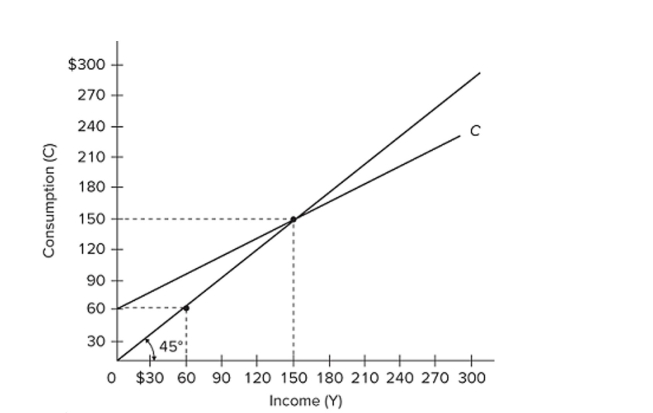 Refer to the diagram. The marginal propensity to consume is
(Multiple Choice)
4.7/5 (36)
Change in income Change in Consumption Change in Saving Assumed Increase in Investment \ 20 \ \ 4.00 Second Round \ \ 12.80 \ All Other Rounds \ \ 51.20 \ Totals \ \ \ 20.00 Refer to the given table, which illustrates the multiplier process. The marginal propensity to consume is
(Multiple Choice)
4.8/5 (31)
Change in Income Change in Consumption Change in Saving Assumed Increase in Investment \ 20 \ \ 4.00 Second Round \ \ 12.80 \ All Other Rounds \ \ 51.20 \ Totals \ \ \ 20.00 Refer to the given table, which illustrates the multiplier process. The multiplier in this economy is
(Multiple Choice)
4.8/5 (29)
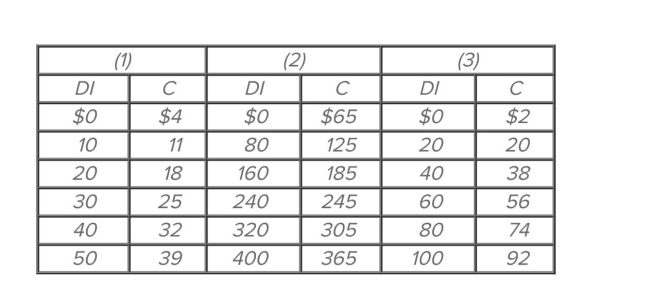 Refer to the given consumption schedules. DI signifies disposable income and C represents consumption expenditures. All figures are in billions of dollars. At an income level of $400 billion, the
Average propensity to save in economy (2) is
Refer to the given consumption schedules. DI signifies disposable income and C represents consumption expenditures. All figures are in billions of dollars. At an income level of $400 billion, the
Average propensity to save in economy (2) is
(Multiple Choice)
5.0/5 (40)
A specific investment will be undertaken if the expected rate of return, r, exceeds the interest rate, i.
(True/False)
4.9/5 (39)
The actual multiplier effect in the U.S. economy is less than the multiplier effect in the text examples because
(Multiple Choice)
4.9/5 (43)
Filters
- Essay(0)
- Multiple Choice(0)
- Short Answer(0)
- True False(0)
- Matching(0)