Exam 10: Basic Macroeconomic Relationships
Exam 2: The Market System and the Circular Flow274 Questions
Exam 3: Demand, Supply, and Market Equilibrium357 Questions
Exam 4: Market Failures Caused by Externalities Asymmetric Information222 Questions
Exam 5: Public Goods, Public Choice, and Government Failure242 Questions
Exam 6: An Introduction to Macroeconomics243 Questions
Exam 7: Measuring Domestic Output and National Income238 Questions
Exam 8: Economic Growth274 Questions
Exam 9: Business Cycles, Unemployment, and Inflation298 Questions
Exam 10: Basic Macroeconomic Relationships233 Questions
Exam 11: The Aggregate Expenditures Model126 Questions
Exam 12: Aggregate Demand and Aggregate Supply320 Questions
Exam 13: Fiscal Policy, Deficits, and Debt401 Questions
Exam 14: Money, Banking, and Financial Institutions265 Questions
Exam 15: Money Creation285 Questions
Exam 16: Interest Rates and Monetary Policy405 Questions
Exam 17: Financial Economics356 Questions
Exam 18: Extending the Analysis of Aggregate Supply268 Questions
Exam 19: Current Issues in Macro Theory and Policy279 Questions
Exam 20: International Trade339 Questions
Exam 21: The Balance of Payments, Exchange Rates, and Trade Deficits315 Questions
Exam 22: The Economics of Developing Countries269 Questions
Select questions type
If disposable income increases from $912 to $927 billion and MPC = 0.6, then consumption will increase by
(Multiple Choice)
4.9/5  (35)
(35)
Suppose that a new machine tool having a useful life of only one year costs $80,000. Suppose, also, that the net additional revenue resulting from buying this tool is expected to be $96,000. The
Expected rate of return on this tool is
(Multiple Choice)
4.9/5 (35)
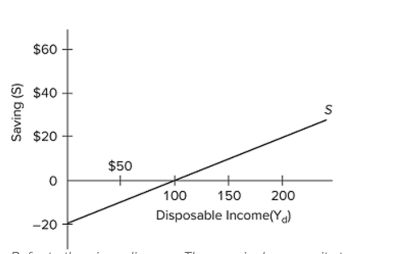 Refer to the given diagram. The marginal propensity to consume is
(Multiple Choice)
4.8/5 (45)
(Advanced analysis) If the equation C = 20 + 0.6Y, where C is consumption and Y is disposable income, were graphed,
(Multiple Choice)
4.8/5 (31)
An MPC value of less than 1.0 indicates that as income increases,
(Multiple Choice)
4.9/5 (29)
Disposable Income Consumption (C) \ 0 \ 40 100 100 200 160 300 220 400 280 (Advanced analysis) Which of the following equations represents the saving schedule implicit in the given data?
(Multiple Choice)
4.7/5 (36)
The investment demand curve will shift to the left as a result of
(Multiple Choice)
4.7/5 (38)
With a marginal propensity to save of 0.4, the marginal propensity to consume will be
(Multiple Choice)
4.8/5 (37)
(Advanced analysis) If the equation for the consumption schedule is C = 20 + 0.8Y, where C is consumption and Y is disposable income, then the average propensity to consume is 1 when
Disposable income is
(Multiple Choice)
4.7/5 (41)
(Advanced analysis) The equation C = 35 + 0.75Y, where C is consumption and Y is disposable income, shows that
(Multiple Choice)
4.9/5 (35)
If the MPC is 0.9 and investment spending increases by $20 billion, real GDP will increase by $200
billion.
(True/False)
4.8/5 (38)
The purchase of capital goods, like ____ consumer goods, can be postponed; it tends to contribute to _____ in investment spending.
(Multiple Choice)
4.7/5 (38)
The consumption schedule shows the relationship of household consumption to the level of
(Multiple Choice)
4.8/5 (29)
If the MPS is only half as large as the MPC, the multiplier is
(Multiple Choice)
4.8/5 (33)
Filters
- Essay(0)
- Multiple Choice(0)
- Short Answer(0)
- True False(0)
- Matching(0)