Exam 10: Basic Macroeconomic Relationships
Exam 2: The Market System and the Circular Flow274 Questions
Exam 3: Demand, Supply, and Market Equilibrium357 Questions
Exam 4: Market Failures Caused by Externalities Asymmetric Information222 Questions
Exam 5: Public Goods, Public Choice, and Government Failure242 Questions
Exam 6: An Introduction to Macroeconomics243 Questions
Exam 7: Measuring Domestic Output and National Income238 Questions
Exam 8: Economic Growth274 Questions
Exam 9: Business Cycles, Unemployment, and Inflation298 Questions
Exam 10: Basic Macroeconomic Relationships233 Questions
Exam 11: The Aggregate Expenditures Model126 Questions
Exam 12: Aggregate Demand and Aggregate Supply320 Questions
Exam 13: Fiscal Policy, Deficits, and Debt401 Questions
Exam 14: Money, Banking, and Financial Institutions265 Questions
Exam 15: Money Creation285 Questions
Exam 16: Interest Rates and Monetary Policy405 Questions
Exam 17: Financial Economics356 Questions
Exam 18: Extending the Analysis of Aggregate Supply268 Questions
Exam 19: Current Issues in Macro Theory and Policy279 Questions
Exam 20: International Trade339 Questions
Exam 21: The Balance of Payments, Exchange Rates, and Trade Deficits315 Questions
Exam 22: The Economics of Developing Countries269 Questions
Select questions type
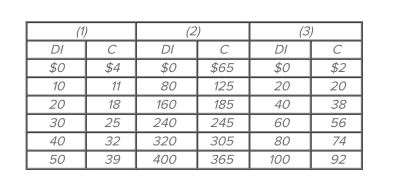 Refer to the given consumption schedules. DI signifies disposable income and C represents consumption expenditures. All figures are in billions of dollars. Suppose that consumption decreased
By $2 billion at each level of DI in each of the three countries. We can conclude that the
Refer to the given consumption schedules. DI signifies disposable income and C represents consumption expenditures. All figures are in billions of dollars. Suppose that consumption decreased
By $2 billion at each level of DI in each of the three countries. We can conclude that the
(Multiple Choice)
4.8/5  (48)
(48)
If for some reason households become increasingly thrifty, we could show this by
(Multiple Choice)
4.8/5 (40)
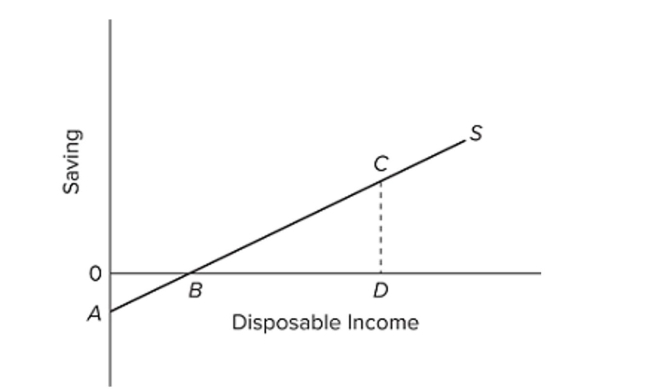 Refer to the diagram. At disposable income level D, consumption is equal to
(Multiple Choice)
4.9/5 (37)
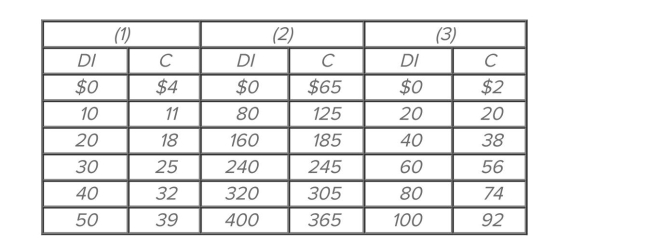 Refer to the given consumption schedules. DI signifies disposable income and C represents consumption expenditures. All figures are in billions of dollars. The marginal propensity to consume
(Multiple Choice)
4.8/5 (28)
Assume the economy's consumption and saving schedules simultaneously shift downward. This must be the result of
(Multiple Choice)
4.8/5 (32)
If the MPC is 0.70 and investment increases by $3 billion, the equilibrium GDP will
(Multiple Choice)
4.8/5 (37)
Assume that for the entire business sector of a private closed economy, there are $0 worth of investment projects that will yield an expected rate of return of 25 percent or more. But there are $15
Worth of investments that will yield an expected rate of return of 20-25 percent, another $15 with an
Expected rate of return of 15-20 percent, and an additional $15 of investment projects in each
Successive rate of return range down to and including the 0-5 percent range. If the real interest rate is
5 percent, what amount of investment will be undertaken?
(Multiple Choice)
4.8/5 (42)
When a consumption schedule is plotted as a straight line, the slope of the consumption line is
(Multiple Choice)
4.8/5 (36)
If the slope of a linear consumption schedule increases in a private closed economy, then it can be concluded that the
(Multiple Choice)
4.8/5 (37)
(Last Word) Art Buchwald's article "Squaring the Economic Circle" is a humorous description of
(Multiple Choice)
4.9/5 (37)
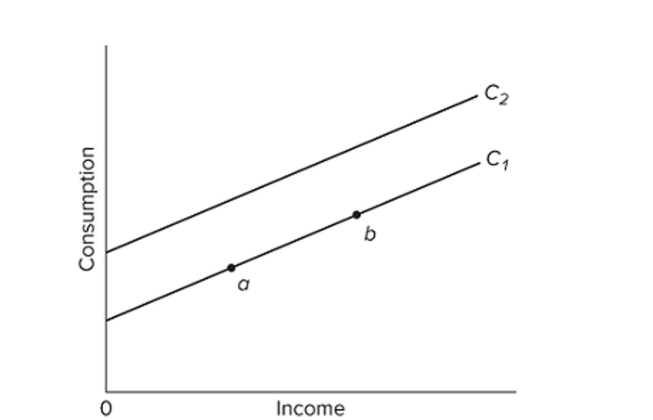 Refer to the given graph. A shift of the consumption schedule from C2 to C1 might be caused by a(n)
(Multiple Choice)
4.9/5 (42)
Other things equal, a decrease in the real interest rate will
(Multiple Choice)
4.9/5 (35)
Other things equal, a 10 percent decrease in corporate income taxes will
(Multiple Choice)
5.0/5 (36)
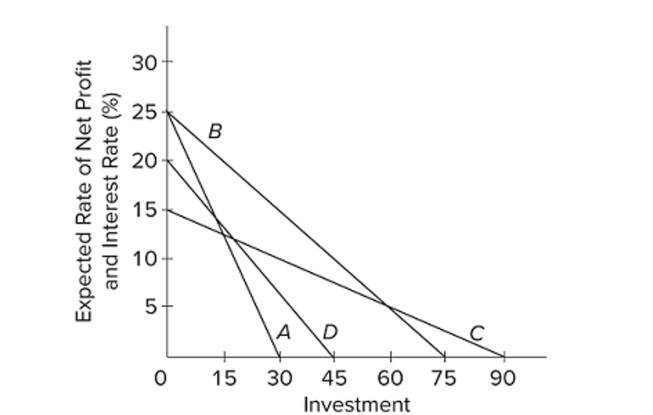 Refer to the diagram. Assume that for the entire business sector of a private closed economy there is $0 worth of investment projects that will yield an expected rate of return of 25 percent or more. But
There are $15 worth of investments that will yield an expected rate of return of 20-25 percent; another
$15 with an expected rate of return of 15-20 percent; and an additional $15 of investment projects in
Each successive rate of return range down to and including the 0-5 percent range. Which of the lines
On the diagram represents these data?
Refer to the diagram. Assume that for the entire business sector of a private closed economy there is $0 worth of investment projects that will yield an expected rate of return of 25 percent or more. But
There are $15 worth of investments that will yield an expected rate of return of 20-25 percent; another
$15 with an expected rate of return of 15-20 percent; and an additional $15 of investment projects in
Each successive rate of return range down to and including the 0-5 percent range. Which of the lines
On the diagram represents these data?
(Multiple Choice)
4.8/5 (33)
Filters
- Essay(0)
- Multiple Choice(0)
- Short Answer(0)
- True False(0)
- Matching(0)