Exam 10: Basic Macroeconomic Relationships
Exam 2: The Market System and the Circular Flow274 Questions
Exam 3: Demand, Supply, and Market Equilibrium357 Questions
Exam 4: Market Failures Caused by Externalities Asymmetric Information222 Questions
Exam 5: Public Goods, Public Choice, and Government Failure242 Questions
Exam 6: An Introduction to Macroeconomics243 Questions
Exam 7: Measuring Domestic Output and National Income238 Questions
Exam 8: Economic Growth274 Questions
Exam 9: Business Cycles, Unemployment, and Inflation298 Questions
Exam 10: Basic Macroeconomic Relationships233 Questions
Exam 11: The Aggregate Expenditures Model126 Questions
Exam 12: Aggregate Demand and Aggregate Supply320 Questions
Exam 13: Fiscal Policy, Deficits, and Debt401 Questions
Exam 14: Money, Banking, and Financial Institutions265 Questions
Exam 15: Money Creation285 Questions
Exam 16: Interest Rates and Monetary Policy405 Questions
Exam 17: Financial Economics356 Questions
Exam 18: Extending the Analysis of Aggregate Supply268 Questions
Exam 19: Current Issues in Macro Theory and Policy279 Questions
Exam 20: International Trade339 Questions
Exam 21: The Balance of Payments, Exchange Rates, and Trade Deficits315 Questions
Exam 22: The Economics of Developing Countries269 Questions
Select questions type
(Advanced analysis) Assume the following consumption schedule: C = 20 + 0.9Y, where C is consumption and Y is disposable income. At an $800 level of disposable income, the level of saving is
(Multiple Choice)
4.8/5  (37)
(37)
Disposable Income Consumption \ 200 \ 205 225 225 250 245 275 265 300 285 Refer to the given data. The marginal propensity to consume is
(Multiple Choice)
4.7/5 (42)
If the real interest rate in the economy is i and the expected rate of return on additional investment is r, then, other things equal,
(Multiple Choice)
4.9/5 (46)
Disposable Income Saving \ 0 -\ 10 50 0 100 10 150 20 200 30 Refer to the given data for a hypothetical economy. If plotted on a graph, the slope of the saving schedule would be
(Multiple Choice)
4.8/5 (42)
At the point where the consumption schedule intersects the 45-degree line,
(Multiple Choice)
4.9/5 (38)
Disposable Income Consumption \ 300 \ 310 350 340 400 370 450 400 500 430 The table shows a consumption schedule. If disposable income is $550, we would expect consumption to be
(Multiple Choice)
4.9/5 (45)
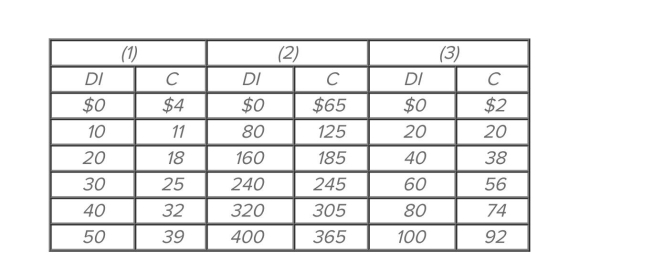 Refer to the given consumption schedules. DI signifies disposable income and C represents consumption expenditures. All figures are in billions of dollars. At an income level of $40 billion, the
Average propensity to consume
Refer to the given consumption schedules. DI signifies disposable income and C represents consumption expenditures. All figures are in billions of dollars. At an income level of $40 billion, the
Average propensity to consume
(Multiple Choice)
4.8/5 (37)
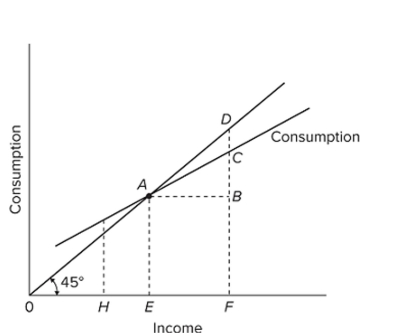 Refer to the given diagram. At income level F, the volume of saving is
(Multiple Choice)
4.8/5 (34)
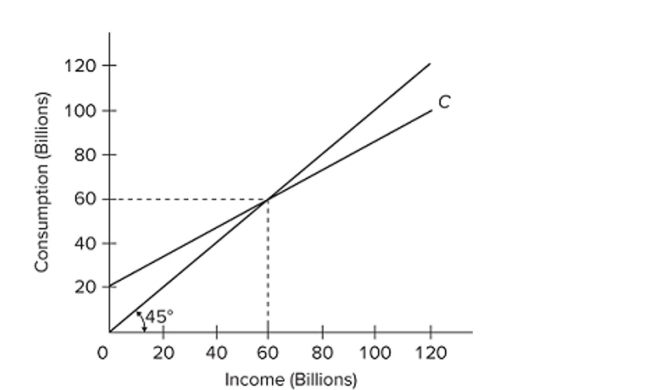 Refer to the given figure. If the relevant saving schedule were constructed,
(Multiple Choice)
4.9/5 (39)
Which of the following statements about consuming in excess of one's disposable income is not true?
(Multiple Choice)
4.9/5 (38)
Disposable Income Saving \ 0 -\ 10 50 0 100 10 150 20 200 30 Refer to the given data for a hypothetical economy. The marginal propensity to consume is
(Multiple Choice)
4.9/5 (38)
Change in Income Change in Consumption Change in Saving Assumed Increase in Investment \ 20 \ \ 4.00 Second Round \ \ 12.80 \ All Other Rounds \ \ 51.20 \ Totals \ \ \ 20.00 Refer to the given table, which illustrates the multiplier process. The marginal propensity to save is
(Multiple Choice)
4.8/5 (29)
The fraction, or percentage, of total income which is consumed is called the
(Multiple Choice)
4.9/5 (35)
Change in Income Change in Consumption Change in Saving Assumed Increase in Investment \ 20 \ \ 4.00 Second Round \ \ 12.80 \ All Other Rounds \ \ 51.20 \ Totals \ \ \ 20.00 Refer to the given table, which illustrates the multiplier process. The total change in consumption resulting from the initial change in investment will be
(Multiple Choice)
4.8/5 (44)
Given the expected rate of return on all possible investment opportunities in the economy,
(Multiple Choice)
4.9/5 (41)
Filters
- Essay(0)
- Multiple Choice(0)
- Short Answer(0)
- True False(0)
- Matching(0)