Exam 10: Basic Macroeconomic Relationships
Exam 2: The Market System and the Circular Flow274 Questions
Exam 3: Demand, Supply, and Market Equilibrium357 Questions
Exam 4: Market Failures Caused by Externalities Asymmetric Information222 Questions
Exam 5: Public Goods, Public Choice, and Government Failure242 Questions
Exam 6: An Introduction to Macroeconomics243 Questions
Exam 7: Measuring Domestic Output and National Income238 Questions
Exam 8: Economic Growth274 Questions
Exam 9: Business Cycles, Unemployment, and Inflation298 Questions
Exam 10: Basic Macroeconomic Relationships233 Questions
Exam 11: The Aggregate Expenditures Model126 Questions
Exam 12: Aggregate Demand and Aggregate Supply320 Questions
Exam 13: Fiscal Policy, Deficits, and Debt401 Questions
Exam 14: Money, Banking, and Financial Institutions265 Questions
Exam 15: Money Creation285 Questions
Exam 16: Interest Rates and Monetary Policy405 Questions
Exam 17: Financial Economics356 Questions
Exam 18: Extending the Analysis of Aggregate Supply268 Questions
Exam 19: Current Issues in Macro Theory and Policy279 Questions
Exam 20: International Trade339 Questions
Exam 21: The Balance of Payments, Exchange Rates, and Trade Deficits315 Questions
Exam 22: The Economics of Developing Countries269 Questions
Select questions type
The saving schedule shows the relationship of saving of households to the level of
(Multiple Choice)
4.8/5  (38)
(38)
Which one of the following will cause a movement up along an economy's saving schedule?
(Multiple Choice)
4.8/5 (28)
The 45-degree line on a graph relating consumption and income shows
(Multiple Choice)
4.9/5 (37)
If the MPC is constant at various levels of income, then the APC must also be constant at all of those
income levels.
(True/False)
4.8/5 (37)
Investment is highly stable; it increases over time at a very steady rate.
(True/False)
5.0/5 (38)
Assume the MPC is 2/3. If investment spending increases by $2 billion, the level of GDP will increase by
(Multiple Choice)
5.0/5 (33)
In a private closed economy, national income is $4.5 trillion and saving equals $6.4 billion. Based on these data, the marginal propensity to consume
(Multiple Choice)
4.8/5 (40)
Change in Income Change in Consumption Change in Saving Assumed Increase in Investment \ 20 \ \ 4.00 Second Round \ \ 12.80 \ All Other Rounds \ \ 51.20 \ Totals \&\ \ 20.00 Refer to the given table, which illustrates the multiplier process. The total change in income resulting from the initial change in investment will be
(Multiple Choice)
4.9/5 (49)
The average propensity to consume is defined as income divided by consumption.
(True/False)
4.9/5 (40)
Investment spending in the United States tends to be unstable because
(Multiple Choice)
4.8/5 (33)
A rightward shift of the investment demand curve might be caused by
(Multiple Choice)
4.9/5 (45)
In an economy, for every $1,600 decrease in income, spending falls by $1,200. It can be concluded that the
(Multiple Choice)
5.0/5 (33)
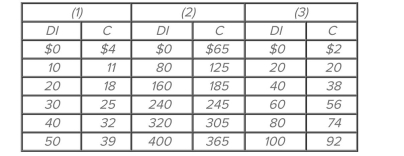 Refer to the given consumption schedules. DI signifies disposable income and C represents consumption expenditures. All figures are in billions of dollars. A $2 billion increase in consumption at
Each level of DI could be caused by
Refer to the given consumption schedules. DI signifies disposable income and C represents consumption expenditures. All figures are in billions of dollars. A $2 billion increase in consumption at
Each level of DI could be caused by
(Multiple Choice)
4.8/5 (40)
Assume that an increase in a household's disposable income from $40,000 to $48,000 leads to an increase in consumption from $35,000 to $41,000, then the
(Multiple Choice)
4.9/5 (35)
The fraction, or percentage, of total income that is saved is called the
(Multiple Choice)
4.8/5 (36)
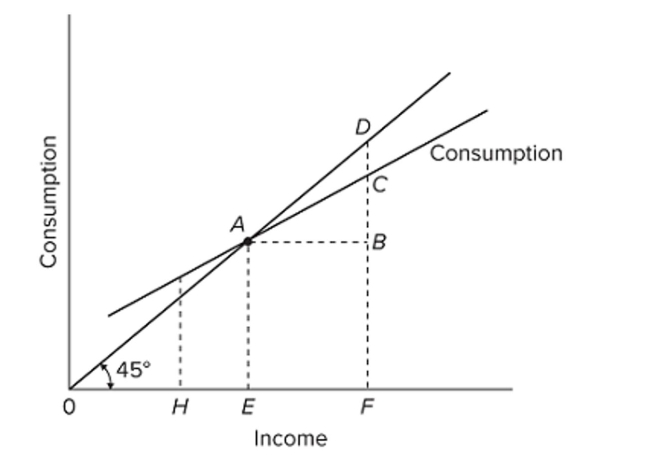 Refer to the given diagram. The marginal propensity to save is
(Multiple Choice)
4.7/5 (39)
Filters
- Essay(0)
- Multiple Choice(0)
- Short Answer(0)
- True False(0)
- Matching(0)