Exam 7: Statistics and Probability
Exam 1: Whole Numbers149 Questions
Exam 2: Fractions156 Questions
Exam 3: Decimals137 Questions
Exam 4: Ratio and Proportion60 Questions
Exam 5: Percents62 Questions
Exam 6: Applications for Business100 Questions
Exam 7: Statistics and Probability84 Questions
Exam 8: Us Units of Measurement87 Questions
Exam 9: Metric System Measurement83 Questions
Exam 10: Rational Numbers114 Questions
Exam 11: Introduction to Algebra114 Questions
Select questions type
The double-broken-line graph shows the number of Calories per day that should be consumed by women and men in various age groups. Use the following graph. People of what age and gender have the lowest recommended number of Calories? 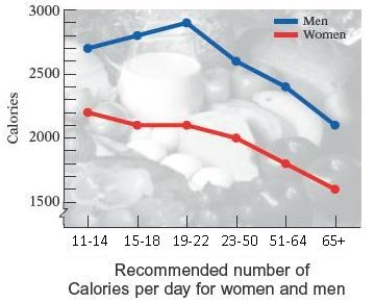
(Multiple Choice)
4.8/5  (38)
(38)
The bar graph shows the health occupations with the largest job growth 2008, and projected 2018, as reported by the U.S. Bureau of Labor Statistics. Use the graph Which two occupations are expected to have job growth rates slightly higher than 50%? 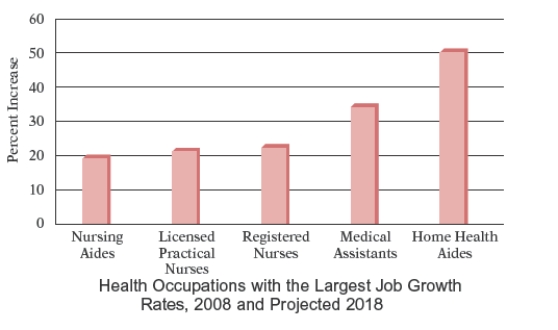
(Multiple Choice)
4.8/5 (42)
The frequency polygon below shows the distances thrown by the entrants in the University and College Discus Finals at the 2003 Drake Relays. What percent of the entrants had distances between 160 and 170 feet? Round your answer to two decimal places. 
(Multiple Choice)
4.7/5 (33)
A dodecahedral die has 12 sides numbered from 1 to 12. The die is rolled once.
a. What is the probability that the upward face shows a number divisible by 2?
b. What is the probability that the upward face shows a number that is a multiple of 11?
(Multiple Choice)
4.9/5 (33)
The circle graph shows the number of students enrolled in the various health programs offered at Southeastern Community College. Find the total number of students enrolled in health programs at Southeastern Community College. 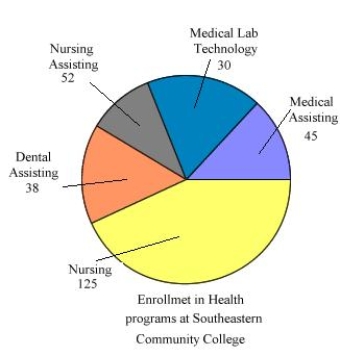
(Multiple Choice)
4.8/5 (27)
The annual tuition for undergraduate college students attending 4-year institutions varies depending on the college. The histogram below shows the tuition amounts for a representative sample of 124 students from various parts of the United States. What percent of the total number of students spend less than $12,000 annually for tuition? Round your answer to two decimal places. 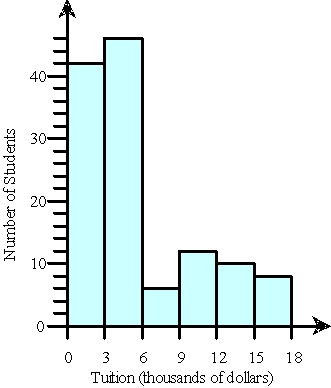
(Multiple Choice)
4.8/5 (40)
The frequency polygon in Figure shows the distribution of scores of the approximately 1,548,000 students who took the SAT Math exam in 2010. Use the following figure Approximately how many students scored between 200 and 300 on the SAT Math exam? 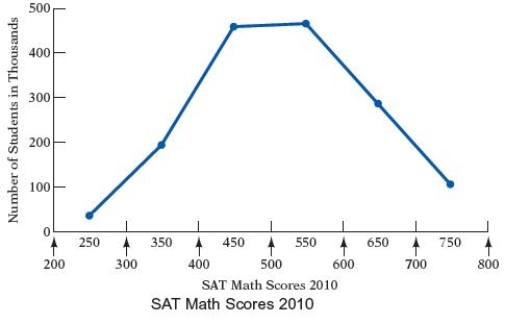
(Multiple Choice)
4.8/5 (27)
The heights, in inches, of the women in a nursing class were recorded. The results are displayed in the frequency polygon in the Figure. Use the following figure. How many women are between 61 inches and 64 inches tall? 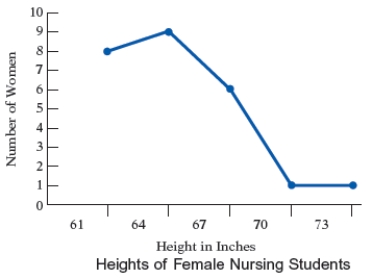
(Multiple Choice)
4.8/5 (41)
A consumer research group purchased identical items in eight grocery stores. The costs for the purchased items were $42.27, $48.60, $37.79, $37.01, $45.21, $38.78, $44.31, and $42.21. Calculate the mean and the median costs of the purchased items. Round your answers to four decimal places.
(Multiple Choice)
4.9/5 (34)
The frequency polygon below shows the distances thrown by the entrants in the University and College Discus Finals at the 2003 Drake Relays. Find the number of entrants with distances of more than 150 feet. 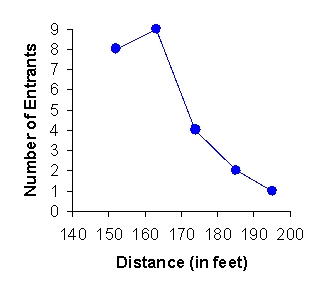
(Multiple Choice)
4.8/5 (36)
Three blue marbles, eight green marbles, and seven red marbles are placed in a bag. One marble is chosen at random.
a. What is the probability that the marble chosen is red?
b. Which is greater, the probability of choosing a blue marble or that of choosing a red marble?
(Multiple Choice)
4.9/5 (33)
The times, in seconds, for a 100-meter dash at a college track meet were 11.00, 10.76, 11.09, 11.50, 10.80, 11.43, 11.22, 11.15, 11.06, and 11.28.
a. Calculate the mean time for the 100-meter dash.
b. Calculate the median time for the 100-meter dash.
(Multiple Choice)
4.9/5 (30)
The box-and-whiskers plot below shows the distribution of median incomes for 50 towns. What is the lowest value in the set of data? The highest value? The first quartile? The third quartile? The median? Find the range and the interquartile range. 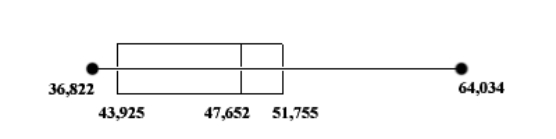
(Multiple Choice)
4.9/5 (43)
The circle graph shows a breakdown, according to age, of the homeless in America. Use the graph. What percent of the homeless population is under the age of 54? 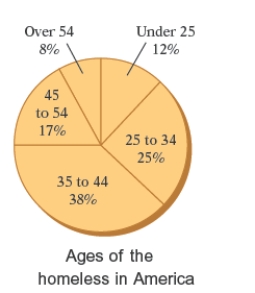
(Multiple Choice)
4.8/5 (34)
The bar graph shows the increasing life expectancy of males in the United States from 1930 to 2010. Use this graph. Between what two decades shown on the graph did the life expectancy increase by approximately one years? 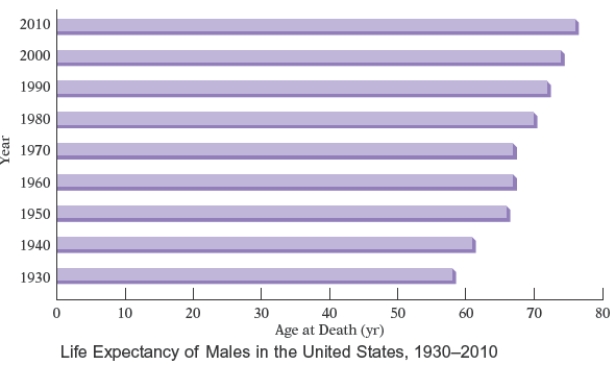
(Multiple Choice)
4.8/5 (37)
The CDC reports that the average length ofstay in a hospital for U.S. citizens is 4.8 days. The following data represent the length of hospital stays for 10 patients released recently from a local hospital: 5, 5, 4, 6, 2, 1, 3, 6, 5, 4. Find the mean of these numbers. Is the mean length of hospital stay for these patients higher or lower than the national average?
(Multiple Choice)
4.9/5 (32)
The pictograph below shows the approximate gross revenues in the United States from four Walt Disney animated movies. Find the ratio of the gross revenue of Beauty and the Beast to the gross revenue of Aladdin. 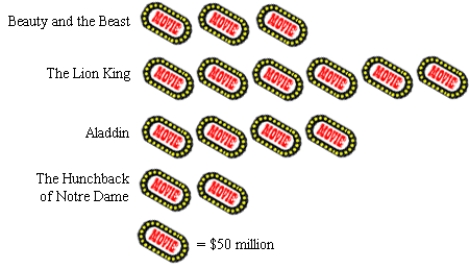
(Multiple Choice)
4.8/5 (36)
Suppose that a typical household in the United States has an average after-tax income of $38,950. The circle graph below represents how this annual income is spent. (Note: It is because of rounding that the percents do not add up to 100%.) Approximately what amount is spent on clothing? 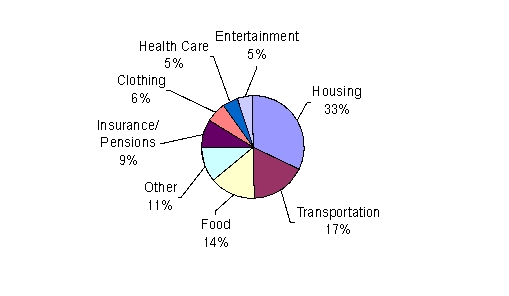
(Multiple Choice)
4.8/5 (28)
An accounting major recorded the number of units required in each discipline to graduate with a degree in accounting. The results are shown in the circle graph below. What percent of the units required to graduate are taken in Humanities? Round your answer to one decimal place. 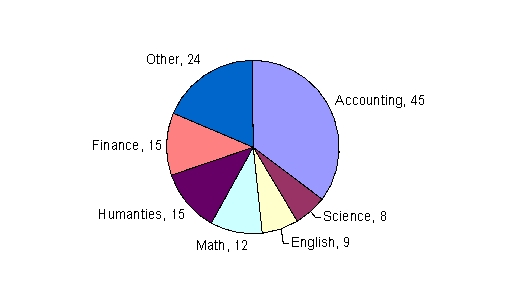
(Multiple Choice)
4.9/5 (41)
The bar graph below shows the regions in which all the passenger cars were produced during a recent year. What percent of the passenger cars were produced in Western Europe? Round your answer to the nearest percent. 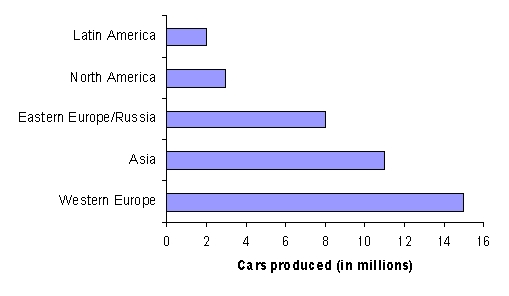
(Multiple Choice)
4.8/5 (37)
Filters
- Essay(0)
- Multiple Choice(0)
- Short Answer(0)
- True False(0)
- Matching(0)