Exam 7: Statistics and Probability
Exam 1: Whole Numbers149 Questions
Exam 2: Fractions156 Questions
Exam 3: Decimals137 Questions
Exam 4: Ratio and Proportion60 Questions
Exam 5: Percents62 Questions
Exam 6: Applications for Business100 Questions
Exam 7: Statistics and Probability84 Questions
Exam 8: Us Units of Measurement87 Questions
Exam 9: Metric System Measurement83 Questions
Exam 10: Rational Numbers114 Questions
Exam 11: Introduction to Algebra114 Questions
Select questions type
The resting heart rates for a group of men involved in a clinical trial of a new medication were recorded at the beginning of the study. The results in beats per minute were 70, 87, 66, 67, 75, 78, 78, 82, 71, 74, 82, and 69.9. Calculate the mean, the median, and the mode of the resting heart rates of the group.
(Multiple Choice)
4.7/5  (37)
(37)
The frequency polygon Figure shows the approximate numbers of runners in the 2008 Boston Marathon to finish in each of the given time slots (times are given in hours and minutes). Use the following figure. Find the approximate number of marathoners who finished with times of more than 3 hours. 
(Multiple Choice)
4.8/5 (41)
An accounting major recorded the number of units required in each discipline to graduate with a degree in accounting. The results are shown in the circle graph below. What is the ratio of the number of units in Math to the number of units in Humanities? 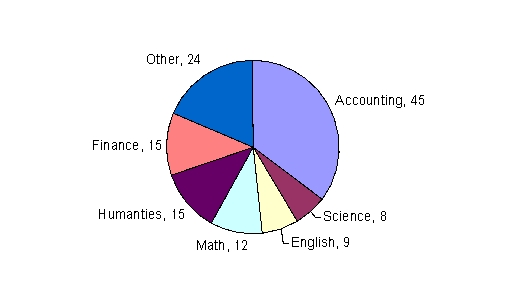
(Multiple Choice)
4.9/5 (42)
The annual tuition for undergraduate college students attending 4-year institutions varies depending on the college. The histogram below shows the tuition amounts for a representative sample of 124 students from various parts of the United States. How many students have a tuition that is between $12,000 and $15,000 per year? 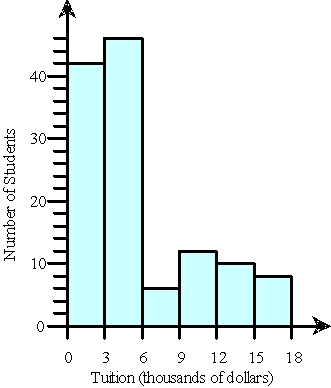
(Multiple Choice)
4.7/5 (40)
The frequency polygon in the below Figure shows the approximate numbers of runners in the 2008 Boston Marathon to finish in each of the given time slots (times are given in hours and minutes). Use the following figure. Determine the approximate number of runners who finished with times between 2 hours and 6 hours. 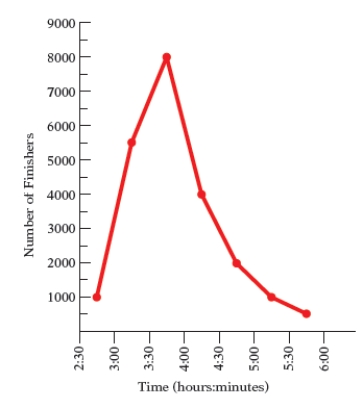
(Multiple Choice)
4.8/5 (28)
The circle graph shows the number of students enrolled in the various health programs offered at Southeastern Community College. What percent of the students enrolled in health programs are enrolled in the medical assisting program? Round to the nearest tenth of a percent. 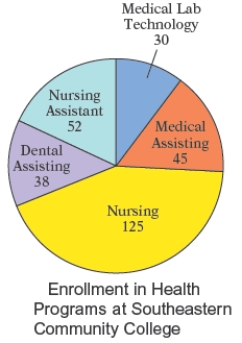
(Multiple Choice)
5.0/5 (32)
The total cholesterol readings for 40 female patients seen this week at a doctor's office were recorded. Figure is a histogram of these data. Use the following figure. How many patients had total cholesterol readings between 500 and 600? 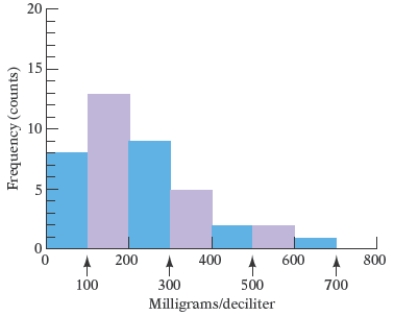
(Multiple Choice)
4.9/5 (41)
The heights, in inches, of the women in a nursing class were recorded. The results are displayed in the frequency polygon in the Figure.Use the following figure. What percent of the women are taller than 64 inches? 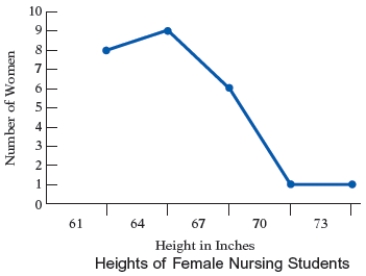
(Multiple Choice)
4.8/5 (40)
The circle graph shows the number of blood donors of each blood type who participated in the previous blood drive at a community college. What is the ratio of donors with type A- blood to those with type O+ blood? 
(Multiple Choice)
4.9/5 (30)
The life expectancies, in years, in ten selected Central and South American countries are given at the below.
a. Find the mean life expectancy in this group of countries.
b. Find the median life expectancy in this group of countries.
COUNTRY LIFE EXPECTANCY Brazil 73 Chile 77 Costa Rica 77 Ecuador 77 Guatemala 82 Panama 85 Peru 82 Trinidad and Tobago 60 Uruguay 88 Venezuela 74
(Multiple Choice)
5.0/5 (33)
The pictograph in the following figure gives typical hourly rates for these health care providers. Use the graph and find the ratio of the hourly rate for a Certified Dental Assistant to the hourly rate for a Certified Nurse Assistant. 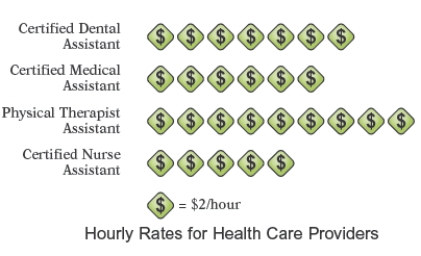
(Multiple Choice)
4.9/5 (37)
The double-broken-line graph shows the number of Calories per day that should be consumed by women and men in various age groups. Use the following graph. What is the difference between the number of Calories recommended for men and the number recommended for women 11 to 14 years of age? 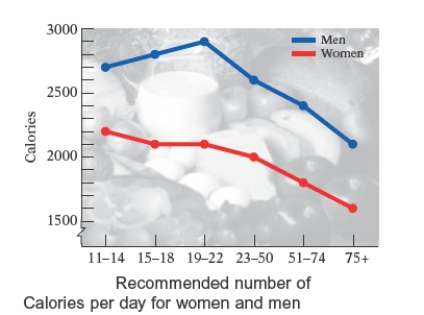
(Multiple Choice)
4.8/5 (36)
The total cholesterol readings for 40 female patients seen this week at a doctor's office were recorded. Figure is a histogram of these data. Use the following figure.If a patient has a total cholesterol reading higher than 300, a doctor may prescribe a cholesterol-lowering medication as well as a change in diet. What percent of these patients had total cholesterol readings higher than 400? 
(Multiple Choice)
4.9/5 (44)
The circle graph shows the number of blood donors of the following blood type who participated in the previous blood drive at a community college. Use the following graph. What percent of donors had blood type A+? Round to the nearest tenth of a percent. 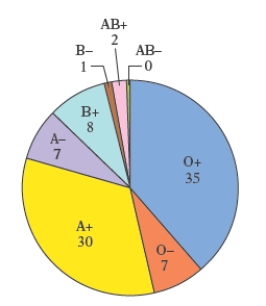
(Multiple Choice)
4.9/5 (40)
The double-bar graph below shows the fuel efficiency of four vehicles, as rated by the Environmental Protection Agency. They are among the most fuel-efficient 2003 model-year cars for city and highway mileage. Is the fuel efficiency of the Toyota Prius greater on the highway or in city driving? 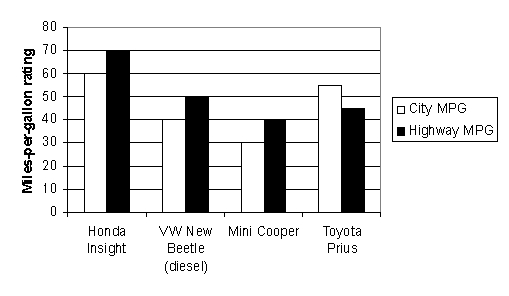
(Multiple Choice)
4.9/5 (33)
Most health statistics list normal body temperature as 98.6°. A recent study of 30 healthy adults recorded their body temperatures at 8 A.M. and then displayed the results in the histogram in the following Figure. Use the Figure. Which class has the highest frequency? 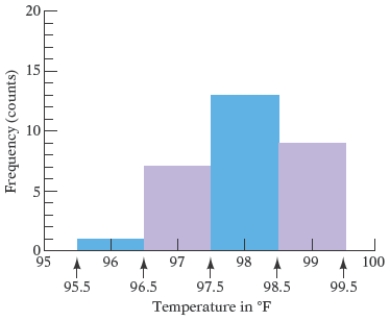
(Multiple Choice)
4.7/5 (46)
Each of the letters of the word MISSISSIPPI is written on a card, and the cards are placed in a hat. One card is drawn at random from the hat.
a. What is the probability that the card has the letter P on it?
b. Which is greater, the probability of choosing a letter P or that of choosing a letter I?
(Multiple Choice)
4.9/5 (28)
The circle graph shows the number of students enrolled in the various health programs offered at Southeastern Community College. What percent of students enrolled in health programs are enrolled in the medical assisting program? Round to the nearest tenth of a percent. 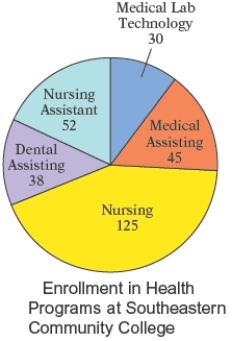
(Multiple Choice)
4.8/5 (46)
Most health statistics list normal body temperature as 98.6°. A recent study of 30 healthy adults recorded their body temperatures at 8 A.M. and then displayed the results in the histogram in the following Figure. Use the Figure and find the percent of body temperatures that were higher than 98.5°. 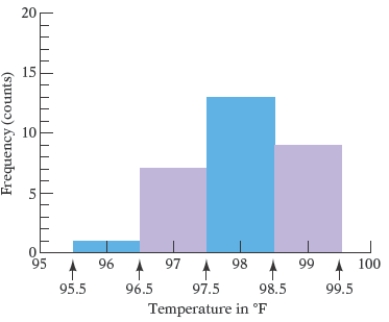
(Multiple Choice)
4.7/5 (28)
The bar graph shows the health occupations with the largest job growth 2008, and projected 2018, as reported by the U.S. Bureau of Labor Statistics. Use the graph How much higher is the predicted growth rate for Licensed Practical Nurses than the predicted growth rate for Nursing Aides? 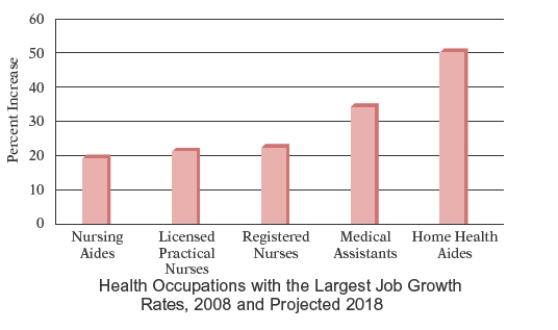
(Multiple Choice)
4.9/5 (44)
Filters
- Essay(0)
- Multiple Choice(0)
- Short Answer(0)
- True False(0)
- Matching(0)