Exam 7: Statistics and Probability
Exam 1: Whole Numbers149 Questions
Exam 2: Fractions156 Questions
Exam 3: Decimals137 Questions
Exam 4: Ratio and Proportion60 Questions
Exam 5: Percents62 Questions
Exam 6: Applications for Business100 Questions
Exam 7: Statistics and Probability84 Questions
Exam 8: Us Units of Measurement87 Questions
Exam 9: Metric System Measurement83 Questions
Exam 10: Rational Numbers114 Questions
Exam 11: Introduction to Algebra114 Questions
Select questions type
Eight health maintenance organizations (HMOs) presented group health insurance plans to a company. The monthly rates per employee were $430, $398, $405, $387, $424, $353, $410 and $435. Calculate the mean and the median monthly rates for these eight companies.
Free
(Multiple Choice)
4.8/5  (36)
(36)
Correct Answer: Verified
C
There are 15 students in the medical assisting class at the community college. Their ages are 22, 27, 21, 30, 44, 26, 23, 24, 46, 37, 38, 30, 24, 22, and 49. Find the mean and median ages of this class of students. Round to the nearest tenth.
Free
(Multiple Choice)
4.8/5 (37)
Correct Answer:Verified
D
There are approximately 300,000,000 people living in the United States. The circle graph in figure given below, shows the breakdown of the U.S. population by ethnic origin. Approximately how many people living in the United States are of American Indian/Alaska Native ethnic origin? 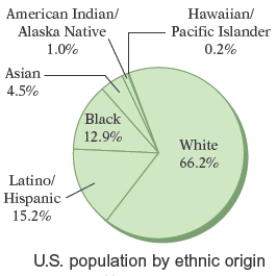
Free
(Multiple Choice)
4.8/5 (35)
Correct Answer:Verified
B
The bar graph shows the increasing life expectancy of males in the United States from 1930 to 2010. Use this graph. In which of the years shown was the life expectancy of males in the United States approximately the same? 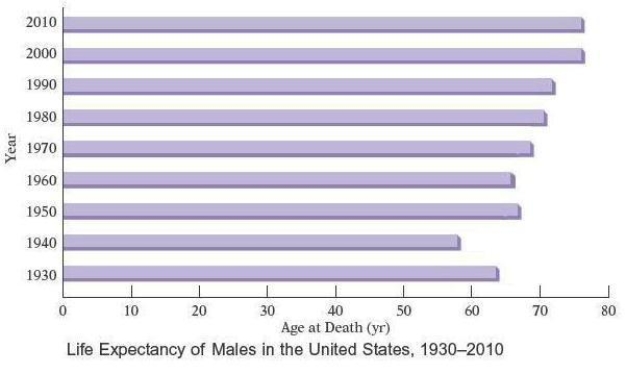
(Multiple Choice)
4.9/5 (36)
A nurse monitors the blood glucose levels of a patient during the patient's hospital stay. The broken-line graph shows the readings during the three-day period. Use this graph. What was the highest blood sugar reading recorded? When was it recorded? 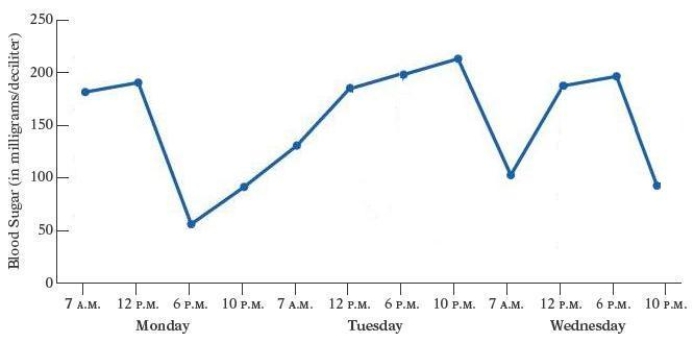
(Multiple Choice)
4.8/5 (29)
The bar graph shows the increasing life expectancy of males in the United States from 1930 to 2010. Use this graph. How much greater is the life expectancy for American males in 2000 than it was in 1960? 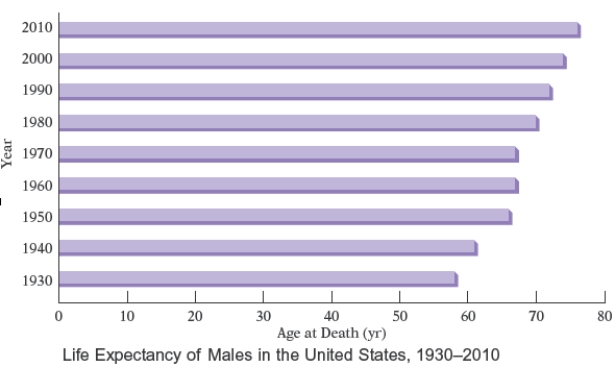
(Multiple Choice)
4.9/5 (46)
The heart rates of 24 women tennis players were measured after each of them had run one-quarter of a mile. The results are listed in the table below.
a. Find the mean, median, and mode for the data. Round to the nearest tenth.
b. Find the range and the interquartile range for the data.
92 103 91 99 92 107 111 91 99 92 103 107 111 107 92 99 83 103 92 103 83 111 107 92
(Multiple Choice)
4.7/5 (42)
The double-broken-line graph below shows the number of Calories per day that should be consumed by women and men in various age groups. Men should consume more Calories than women. People of what age and gender have the highest recommended number of Calories? 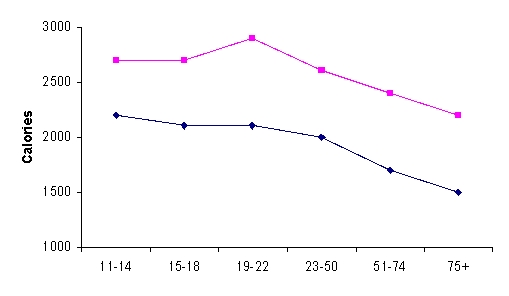
(Multiple Choice)
4.8/5 (42)
The circle graph shows the number of students enrolled in the various health programs offered at Southeastern Community College. How many more students are in the nursing assisting than in the medical assisting program? 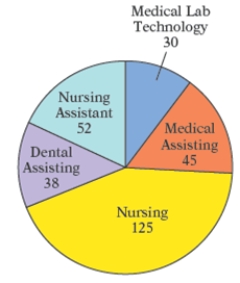
(Multiple Choice)
5.0/5 (33)
The cholesterol levels for 100 adults were recorded and then displayed in the box-and-whiskers plot shown below.
a. How many adults had a cholestorol level above 212?
b. How many adults had a cholestorol level below 249?
c. How many cholestorol levels are represented in each quartile?
d. What percent of the adults had a cholestorol level of not more than 193? 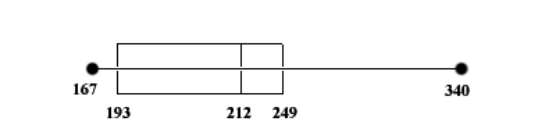
(Multiple Choice)
4.8/5 (41)
The circle graph shows the budget allocation for the Griner family's income. The annual family income is $125,000. Find the amount of money budgeted annually for vehicle and housing and utilities. 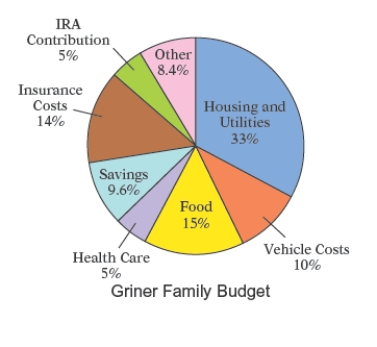
(Multiple Choice)
4.9/5 (46)
A consumer research group purchased identical items in eight drugstores. The costs for the purchased items were $85.74, $90.7, $81.43, $80.65, $88.73, $82.42, $87.9, and $85.82. Calculate the mean and the median costs of the purchased items.
(Multiple Choice)
4.9/5 (43)
The bar graph below shows the regions in which all the passenger cars were produced during a recent year. What is the difference between the number of passenger cars produced in Western Europe and the number produced in Eastern Europe/Russia? 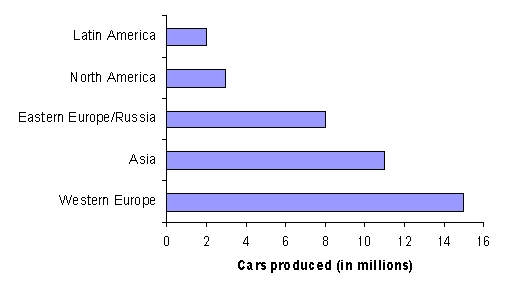
(Multiple Choice)
4.9/5 (35)
The double-broken-line graph below shows the number of Calories per day that should be consumed by women and men in various age groups. Men should consume more Calories than women. What is the difference between the number of Calories recommended for men and the number recommended for women 19-22 years of age? 
(Multiple Choice)
4.8/5 (36)
The annual tuition for undergraduate college students attending 4-year institutions varies depending on the college. The histogram below shows the tuition amounts for a representative sample of 124 students from various parts of the United States. How many students pay more than $6000 annually for tuition? 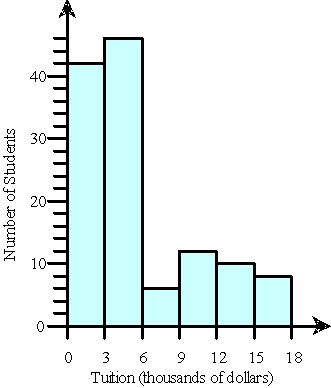
(Multiple Choice)
4.7/5 (30)
The pictograph below shows the approximate gross revenues in the United States from four Walt Disney animated movies. Find the percent of the total gross revenue that was earned by The Lion King. Round your answer to two decimal places. 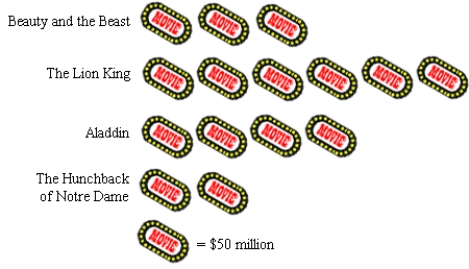
(Multiple Choice)
4.8/5 (41)
The broken-line graph below shows the average monthly snowfall during ski season around Aspen, Colorado. During which month is the snowfall the least? 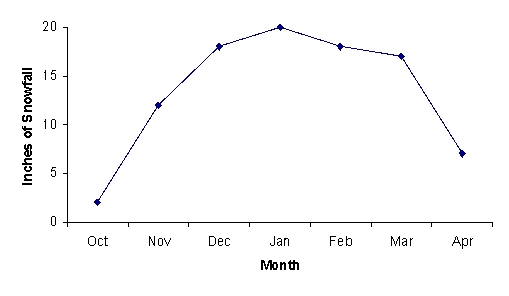
(Multiple Choice)
4.9/5 (38)
Most health statistics list normal body temperature as 98.6°. A recent study of 30 healthy adults recorded their body temperatures at 8 A.M. and then displayed the results in the histogram given below. Use the figure. How many body temperatures were lower than 96.5°? 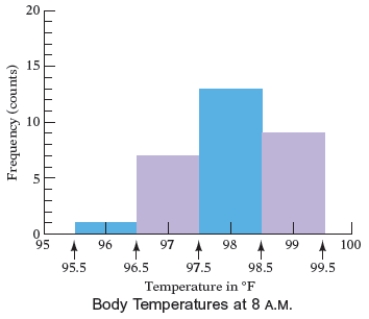
(Multiple Choice)
4.9/5 (35)
The broken-line graph shows the percent of adults in the United States over 18 years old who took the influenza vaccine during recent years. Use the graph. What percent of U.S. adults aged 18 and older took the influenza vaccine in 2003? 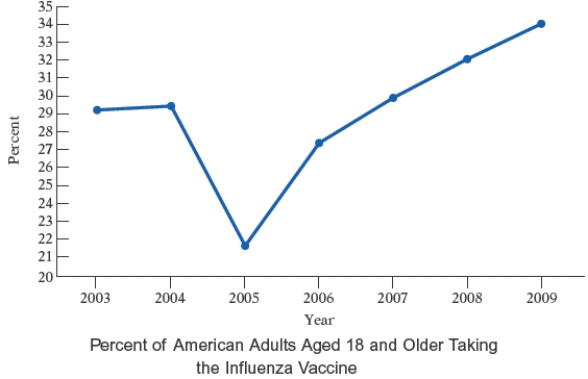
(Multiple Choice)
4.9/5 (34)
A consumer research group recently reported the amount of sugar in 12-ounce servings of six popular soft drinks. The results in grams were 29, 52, 31.5, 36, 47, and 52. Calculate the mean, the median, and the mode of the amount of sugar in these soft drinks.
(Multiple Choice)
4.8/5 (31)
Filters
- Essay(0)
- Multiple Choice(0)
- Short Answer(0)
- True False(0)
- Matching(0)