Exam 3: Functions and Graphs
Exam 1: Fundamental Concepts of Algebra119 Questions
Exam 2: Equations and Inequalities94 Questions
Exam 3: Functions and Graphs96 Questions
Exam 4: Polynomial and Rational Functions105 Questions
Exam 5: Exponential and Logarithmic Functions94 Questions
Exam 6: Systems of Equations and Inequalities96 Questions
Exam 7: Matrices and Determinants94 Questions
Exam 8: Limits and Derivatives77 Questions
Exam 9: Applications of the Derivative83 Questions
Exam 10: Further Applications of the Derivative83 Questions
Exam 11: Derivatives of Exponential and Logarithmic Functions121 Questions
Exam 12: Integration and Its Applications74 Questions
Exam 13: Techniques of Integration50 Questions
Exam 14: Functions of Several Variables92 Questions
Exam 15: Trigonometric Functions Web60 Questions
Exam 16: Series and Taylor Polynomials Web127 Questions
Exam 17: Probability Web89 Questions
Select questions type
Plot the points and find the slope of the line passing through the pair of points. (1, 0), (-2, 0) 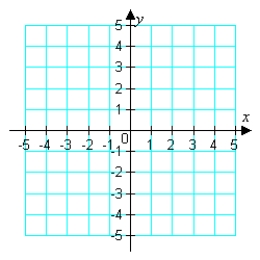
Free
(Multiple Choice)
4.7/5  (31)
(31)
Correct Answer: Verified
A
Use the graph of to write an equation for the function whose graphs is shown below. 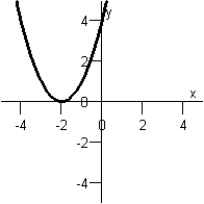
Free
(Multiple Choice)
4.8/5 (36)
Correct Answer:Verified
C
Which of the following graphs below can be approximated by a linear model? I 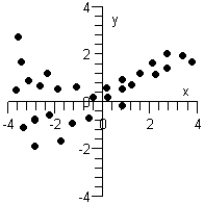 II
II 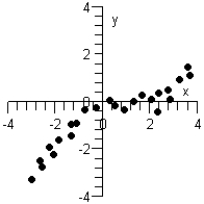 III
III 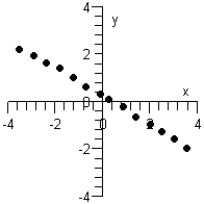
(Multiple Choice)
4.7/5 (41)
The sales tax on an item with a retail price of $612 is $61.20. Create a mathematical model that gives the retail price, y, in terms of the sales tax, x, and use it to determine the retail price of an item that has a sales tax of $70.38.
(Multiple Choice)
4.9/5 (43)
Find the x- and y-intercepts of the graph of the equation below.
(Multiple Choice)
5.0/5 (32)
You own two fast-food restaurants. During the years 2000 to 2008, the sales for the first restaurant have been increasing according to the function where represents the sales (in thousands of dollars) and represents the year, with corresponding to 2000. During the same nine-year period, the sales for the second restaurant have been decreasing according to the function Write a function that represents the total sales for the two restaurants to determine whether the total sales have been increasing or decreasing.
(Multiple Choice)
4.9/5 (39)
The table below shows the velocities, in feet per second, of a ball that is thrown horizontally from the top of a 50 foot building and the distances, in feet, that it lands from the base of the building. Compute the linear regression equation for these data. Velocity (/) Distance () 15 48 25 80 29 100 33 95 38 112 40 130 48 150
(Multiple Choice)
4.9/5 (36)
The monthly cost C of running the machinery in a factory for t hours is given by The number of hours t needed to produce x products is given by Find the equation representing the cost C of manufacturing x products.
(Multiple Choice)
4.7/5 (40)
Find the x- and y-intercepts of the graph of the following equation.
(Multiple Choice)
4.8/5 (35)
Use the graph of to write an equation for the function whose graph is shown. 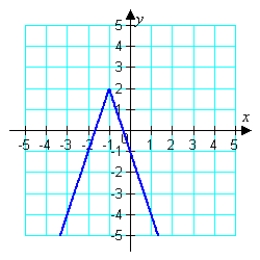
(Multiple Choice)
4.8/5 (39)
Use the point on the line and the slope of the line to determine whether any of the three additional points lies on the line. Point Slope
I:
II:
III:
(Multiple Choice)
4.9/5 (32)
The national defense budget expenses (in billions of dollars) for veterans in the United States from 1990 to 2005 can be approximated by the model where represents the year, with corresponding to 1990. Use the model to find total veteran expenses in 1995.
(Multiple Choice)
4.8/5 (37)
A pebble is dropped into a calm pond, causing ripples in the form of concentric circles. The radius (in feet) of the outermost ripple is given by where is time in seconds after the pebble strikes the water. The area of the outermost circle is given by the function Find and interpret
(Multiple Choice)
4.9/5 (35)
Suppose the average remaining lifetime for women in a given country is given in the following table. Age Years 5 75.2 30 54.3 50 37.5 65 25.4 75 17.0 Compute the linear regression equation for these data, where x is the age, in years, and A is the remaining lifetime, in years. Round parameters to the nearest hundredth.
(Multiple Choice)
4.8/5 (42)
Filters
- Essay(0)
- Multiple Choice(0)
- Short Answer(0)
- True False(0)
- Matching(0)