Exam 10: Two-Sample Tests
Exam 1: Defining and Collecting Data207 Questions
Exam 2: Organizing and Visualizing Variables213 Questions
Exam 3: Numerical Descriptive Measures167 Questions
Exam 4: Basic Probability171 Questions
Exam 5: Discrete Probability Distributions217 Questions
Exam 6: The Normal Distributions and Other Continuous Distributions189 Questions
Exam 7: Sampling Distributions135 Questions
Exam 8: Confidence Interval Estimation189 Questions
Exam 9: Fundamentals of Hypothesis Testing: One-Sample Tests187 Questions
Exam 10: Two-Sample Tests208 Questions
Exam 11: Analysis of Variance216 Questions
Exam 12: Chi-Square and Nonparametric Tests178 Questions
Exam 13: Simple Linear Regression214 Questions
Exam 14: Introduction to Multiple Regression336 Questions
Exam 15: Multiple Regression Model Building99 Questions
Exam 16: Time-Series Forecasting173 Questions
Exam 17: Business Analytics115 Questions
Exam 18: A Roadmap for Analyzing Data329 Questions
Exam 19: Statistical Applications in Quality Management Online162 Questions
Exam 20: Decision Making Online129 Questions
Exam 21: Understanding Statistics: Descriptive and Inferential Techniques39 Questions
Select questions type
SCENARIO 10-1 Are Japanese managers more motivated than American managers? A randomly selected group of each were administered the Sarnoff Survey of Attitudes Toward Life (SSATL), which measures motivation for upward mobility.The SSATL scores are summarized below. 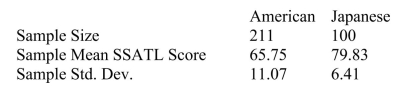 -Referring to Scenario 10-1, what is the value of the test statistic?
(Multiple Choice)
4.8/5  (37)
(37)
SCENARIO 10-14 The use of preservatives by food processors has become a controversial issue.Suppose two preservatives are extensively tested and determined safe for use in meats.A processor wants to compare the preservatives for their effects on retarding spoilage.Suppose 15 cuts of fresh meat are treated with preservative I and 15 are treated with preservative II, and the number of hours until spoilage begins is recorded for each of the 30 cuts of meat.The results are summarized in the table below. 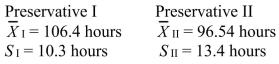 -Referring to Scenario 10-14, what is the largest level of significance at which a test of whether the population variances differ for preservatives I and II will not be rejected?
(Essay)
4.8/5 (38)
SCENARIO 10-15 The table below presents the summary statistics for the starting annual salaries (in thousands of dollars)for individuals entering the public accounting and financial planning professions. 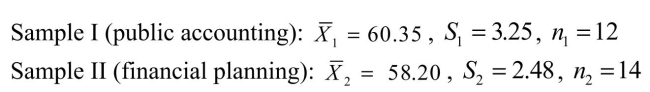 Test whether the mean starting annual salaries for individuals entering the public accounting professions is higher than that of financial planning assuming that the two population variances are the same.
-Referring to Scenario 10-15, what assumptions are necessary for testing whether there is evidence of a difference in the variances to be valid?
Test whether the mean starting annual salaries for individuals entering the public accounting professions is higher than that of financial planning assuming that the two population variances are the same.
-Referring to Scenario 10-15, what assumptions are necessary for testing whether there is evidence of a difference in the variances to be valid?
(Multiple Choice)
4.9/5 (49)
A researcher randomly sampled 30 graduates of an MBA program and recorded data concerning
their starting salaries. Of primary interest to the researcher was the effect of gender on starting
salaries. The result of the pooled-variance t-test of the mean salaries of the females (Population
1) and males (Population 2) in the sample is given below.
 -Referring to Scenario 10-2, the researcher was attempting to show statistically that the female MBA graduates have a significantly lower mean starting salary than the male MBA graduates.What assumptions were necessary to conduct this hypothesis test?
(Multiple Choice)
4.8/5 (37)
SCENARIO 10-7 A buyer for a manufacturing plant suspects that his primary supplier of raw materials is overcharging.In order to determine if his suspicion is correct, he contacts a second supplier and asks for the prices on various identical materials.He wants to compare these prices with those of his primary supplier.The data collected is presented in the table below, with some summary statistics presented (all of these might not be necessary to answer the questions which follow). The buyer believes that the differences are normally distributed and will use this sample to perform an appropriate test at a level of significance of 0.01. 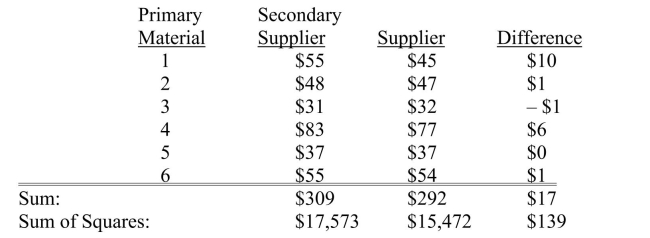 -Referring to Scenario 10-7, the decision rule is to reject the null hypothesis if ________.
(Short Answer)
4.7/5 (42)
SCENARIO 10-4 Two samples each of size 25 are taken from independent populations assumed to be normally distributed with equal variances.The first sample has a mean of 35.5 and standard deviation of 3.0 while the second sample has a mean of 33.0 and standard deviation of 4.0.
-Referring to Scenario 10-4, the p-value for a two-tail test is _______.
(Short Answer)
5.0/5 (27)
SCENARIO 10-15 The table below presents the summary statistics for the starting annual salaries (in thousands of dollars)for individuals entering the public accounting and financial planning professions. Test whether the mean starting annual salaries for individuals entering the public accounting professions is higher than that of financial planning assuming that the two population variances are the same.
-Referring to Scenario 10-15, what is the smallest level of significance at which the null hypothesis will still not be rejected?
(Short Answer)
4.8/5 (44)
SCENARIO 10-15 The table below presents the summary statistics for the starting annual salaries (in thousands of dollars)for individuals entering the public accounting and financial planning professions. Test whether the mean starting annual salaries for individuals entering the public accounting professions is higher than that of financial planning assuming that the two population variances are the same.
-Referring to Scenario 10-15, state the null and alternative hypotheses for testing whether there is evidence of a difference in the variances of the starting annual salaries.
(Multiple Choice)
4.9/5 (34)
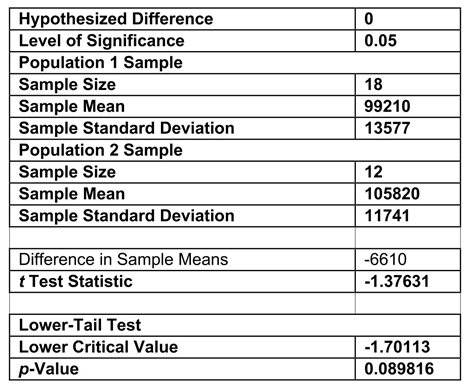
SCENARIO 10-3 A real estate company is interested in testing whether the mean time that families in Gotham have been living in their current homes is less than families in Metropolis.Assume that the two population variances are equal.A random sample of 100 families from Gotham and a random sample of 150 families in Metropolis yield the following data on length of residence in current homes.  -Referring to Scenario 10-3, what is a point estimate in months of residence for the mean of the sampling distribution of the difference between the two sample means?
(Multiple Choice)
4.9/5 (45)
In testing for differences between the means of 2 related populations where the variance of the differences is unknown, the degrees of freedom are
(Multiple Choice)
5.0/5 (45)
SCENARIO 10-9 The following EXCEL output contains the results of a test to determine whether the proportions of satisfied customers at two resorts are the same or different. 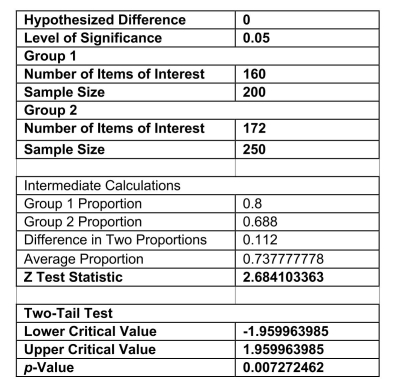 -Referring to Scenario 10-9, if you want to test the claim that "Resort 1 (Group 1)has a lower proportion of satisfied customers compared to Resort 2 (Group 2)", you will use
(Multiple Choice)
4.8/5 (34)
SCENARIO 10-4 Two samples each of size 25 are taken from independent populations assumed to be normally distributed with equal variances.The first sample has a mean of 35.5 and standard deviation of 3.0 while the second sample has a mean of 33.0 and standard deviation of 4.0.
-Referring to Scenario 10-6, the pooled (i.e., combined)variance is _______.
(Short Answer)
4.9/5 (31)
In testing for the differences between the means of two related populations, the _______ hypothesis is the hypothesis of "no differences."
(Short Answer)
4.9/5 (40)
SCENARIO 10-7 A buyer for a manufacturing plant suspects that his primary supplier of raw materials is overcharging.In order to determine if his suspicion is correct, he contacts a second supplier and asks for the prices on various identical materials.He wants to compare these prices with those of his primary supplier.The data collected is presented in the table below, with some summary statistics presented (all of these might not be necessary to answer the questions which follow). The buyer believes that the differences are normally distributed and will use this sample to perform an appropriate test at a level of significance of 0.01.
-Referring to Scenario 10-7, if the buyer had decided to perform a two-tail test, the p-value would have been ________.
(Short Answer)
4.9/5 (43)
If you wish to determine whether there is evidence that the proportion of items of interest is higher in Group 1 than in Group 2, and the test statistic for Z = +2.07 where the difference is defined as Group 1's proportion minus Group 2's proportion, the p-value is equal to ______.
(Essay)
4.8/5 (38)
SCENARIO 10-3 A real estate company is interested in testing whether the mean time that families in Gotham have been living in their current homes is less than families in Metropolis.Assume that the two population variances are equal.A random sample of 100 families from Gotham and a random sample of 150 families in Metropolis yield the following data on length of residence in current homes.
-Referring to Scenario 10-3, suppose  = 0.05.Which of the following represents the correct conclusion?
(Multiple Choice)
4.9/5 (37)
SCENARIO 10-9 The following EXCEL output contains the results of a test to determine whether the proportions of satisfied customers at two resorts are the same or different.
-Referring to Scenario 10-9, construct a 99% confidence interval estimate of the difference in the population proportion of satisfied customers between the two resorts.
(Short Answer)
4.7/5 (42)
A statistics professor wanted to test whether the grades on a statistics test were the same for upper and lower classmen.The professor took a random sample of size 10 from each, conducted a test and found out that the variances were equal.For this situation, the professor should use a t test with independent samples.
(True/False)
4.8/5 (38)
SCENARIO 10-5 To test the effectiveness of a business school preparation course, 8 students took a general business test before and after the course.The results are given below. 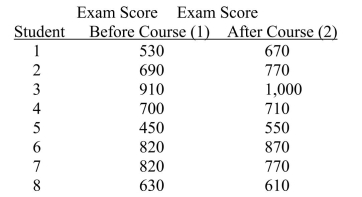 -Referring to Scenario 10-5, in examining the differences between related samples we are essentially sampling from an underlying population of difference "scores."
(True/False)
4.7/5 (28)
Filters
- Essay(0)
- Multiple Choice(0)
- Short Answer(0)
- True False(0)
- Matching(0)